
A English
Instantaneous Velocity and Speed and Velocity-time Graph Questions in English
Class 11 Physics · Motion in Straight Line · Instantaneous Velocity and Speed and Velocity-time Graph
244+
Questions
English
Language
100%
With Solutions
Showing 49 of 244 questions in English
1
MediumMCQ
The displacement-time graph for two particles $A$ and $B$ are straight lines inclined at angles of $30^\circ$ and $60^\circ$ with the time axis. The ratio of velocities $V_A:V_B$ is
A
$1:2$
B
$1:\sqrt{3}$
C
$\sqrt{3}:1$
D
$1:3$
Solution
(D) The velocity of a particle in a displacement-time graph is given by the slope of the line,which is $\tan \theta$,where $\theta$ is the angle the line makes with the time axis.
For particle $A$,the angle is $\theta_A = 30^\circ$,so $V_A = \tan 30^\circ = 1/\sqrt{3}$.
For particle $B$,the angle is $\theta_B = 60^\circ$,so $V_B = \tan 60^\circ = \sqrt{3}$.
The ratio of velocities is $\frac{V_A}{V_B} = \frac{\tan 30^\circ}{\tan 60^\circ} = \frac{1/\sqrt{3}}{\sqrt{3}} = \frac{1}{3}$.
Therefore,the ratio $V_A:V_B$ is $1:3$.
0 likes
View Solution2
EasyMCQ
The instantaneous velocity of a body can be measured by:
A
Graphically
B
Vectorially
C
By speedometer
D
Both $(a)$ and $(c)$
Solution
(D) The tangent to a curve at any instant on an $x-t$ (position-time) graph gives the instantaneous velocity of the body.
$A$ speedometer in a vehicle reads the instantaneous velocity of the body at every instant.
Thus,the instantaneous velocity of the body can be measured both graphically and by a speedometer.
$A$ speedometer in a vehicle reads the instantaneous velocity of the body at every instant.
Thus,the instantaneous velocity of the body can be measured both graphically and by a speedometer.
0 likes
View Solution3
EasyMCQ
The displacement of a particle starting from rest (at $t = 0$) is given by $s = 6t^2 - t^3$. The time in seconds at which the particle will attain zero velocity again,is ..... $s$.
A
$2$
B
$4$
C
$6$
D
$8$
Solution
(B) The displacement of the particle is given by $s = 6t^2 - t^3$.
Velocity $v$ is the rate of change of displacement with respect to time,given by $v = \frac{ds}{dt}$.
$v = \frac{d}{dt}(6t^2 - t^3) = 12t - 3t^2$.
To find the time when the velocity is zero,we set $v = 0$:
$12t - 3t^2 = 0$.
$3t(4 - t) = 0$.
This gives $t = 0 \ s$ and $t = 4 \ s$.
The particle starts from rest at $t = 0 \ s$,so it will attain zero velocity again at $t = 4 \ s$.
0 likes
View Solution4
EasyMCQ
The motion of a particle is described by the equation $x = a + bt^2$ where $a = 15 \, cm$ and $b = 3 \, cm/s^2$. Its instantaneous velocity at time $t = 3 \, s$ will be ........ $cm/s$.
A
$36$
B
$18$
C
$16$
D
$32$
Solution
(B) The position of the particle is given by the equation $x = a + bt^2$.
To find the instantaneous velocity $v$,we differentiate the position $x$ with respect to time $t$:
$v = \frac{dx}{dt} = \frac{d}{dt}(a + bt^2)$
Since $a$ is a constant,its derivative is $0$. Thus,$v = 2bt$.
Given $b = 3 \, cm/s^2$ and $t = 3 \, s$,we substitute these values into the velocity equation:
$v = 2 \times 3 \times 3 = 18 \, cm/s$.
Therefore,the instantaneous velocity at $t = 3 \, s$ is $18 \, cm/s$.
0 likes
View Solution5
DifficultMCQ
The relation $3t = \sqrt{3x} + 6$ describes the displacement of a particle in one direction,where $x$ is in $m$ and $t$ is in $s$. The displacement,when velocity is zero,is ......... $m$.
A
$24$
B
$12$
C
$5$
D
$0$
Solution
(D) Given the relation: $3t = \sqrt{3x} + 6$.
Rearranging for $\sqrt{3x}$: $\sqrt{3x} = 3t - 6$.
Squaring both sides: $3x = (3t - 6)^2 = 9t^2 - 36t + 36$.
Dividing by $3$: $x = 3t^2 - 12t + 12$.
Velocity $v$ is the derivative of displacement $x$ with respect to time $t$: $v = \frac{dx}{dt} = \frac{d}{dt}(3t^2 - 12t + 12) = 6t - 12$.
For velocity to be zero: $6t - 12 = 0 \Rightarrow t = 2 \ s$.
Substituting $t = 2 \ s$ into the displacement equation: $x = 3(2)^2 - 12(2) + 12 = 12 - 24 + 12 = 0 \ m$.
1 likes
View Solution6
MediumMCQ
$A$ particle moves along $X$-axis in such a way that its coordinate $x$ varies with time $t$ according to the equation $x = (2 - 5t + 6t^2) \ m$. The initial velocity of the particle is ....... $m/s$.
A
$ - 5$
B
$6$
C
$ - 3$
D
$3$
Solution
(A) The velocity $v$ of the particle is given by the derivative of the position $x$ with respect to time $t$:
$v = \frac{dx}{dt} = \frac{d}{dt}(2 - 5t + 6t^2)$
$v = 0 - 5 + 12t$
$v = (12t - 5) \ m/s$
To find the initial velocity,we substitute $t = 0$ into the velocity equation:
$v(0) = 12(0) - 5 = -5 \ m/s$
Thus,the initial velocity of the particle is $-5 \ m/s$.
$v = \frac{dx}{dt} = \frac{d}{dt}(2 - 5t + 6t^2)$
$v = 0 - 5 + 12t$
$v = (12t - 5) \ m/s$
To find the initial velocity,we substitute $t = 0$ into the velocity equation:
$v(0) = 12(0) - 5 = -5 \ m/s$
Thus,the initial velocity of the particle is $-5 \ m/s$.
0 likes
View Solution7
DifficultMCQ
The displacement $x$ of a particle varies with time $t$ as $x = a e^{-\alpha t} + b e^{\beta t}$,where $a, b, \alpha, \text{and } \beta$ are positive constants. The velocity of the particle will:
A
Go on decreasing with time
B
Be independent of $\alpha$ and $\beta$
C
Drop to zero when $\alpha = \beta$
D
Go on increasing with time
Solution
(D) Given displacement $x = a e^{-\alpha t} + b e^{\beta t}$.
Velocity $v$ is the rate of change of displacement with respect to time:
$v = \frac{dx}{dt} = \frac{d}{dt}(a e^{-\alpha t} + b e^{\beta t})$
$v = -a\alpha e^{-\alpha t} + b\beta e^{\beta t}$.
To determine how velocity changes with time,we find the acceleration $a_{acc}$:
$a_{acc} = \frac{dv}{dt} = \frac{d}{dt}(-a\alpha e^{-\alpha t} + b\beta e^{\beta t})$
$a_{acc} = a\alpha^2 e^{-\alpha t} + b\beta^2 e^{\beta t}$.
Since $a, b, \alpha, \beta$ are positive constants and the exponential functions $e^{-\alpha t}$ and $e^{\beta t}$ are always positive for any time $t$,the acceleration $a_{acc}$ is always positive.
Because the acceleration is positive,the velocity $v$ will go on increasing with time.
0 likes
View Solution8
MediumMCQ
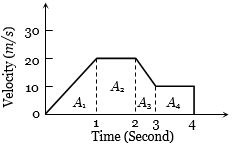
The variation of velocity of a particle with time moving along a straight line is illustrated in the following figure. The distance travelled by the particle in $4 \; s$ is ......... $m$.
A
$60$
B
$55$
C
$25$
D
$30$
Solution
(B) The distance travelled by a particle is equal to the area under the velocity-time $(v-t)$ graph.
From the given graph,the total distance is the sum of the areas of the four geometric shapes $(A_1, A_2, A_3, A_4)$:
$1$. Area $A_1$ (triangle from $t=0$ to $t=1$): $\frac{1}{2} \times \text{base} \times \text{height} = \frac{1}{2} \times 1 \times 20 = 10 \; m$.
$2$. Area $A_2$ (rectangle from $t=1$ to $t=2$): $\text{length} \times \text{breadth} = 1 \times 20 = 20 \; m$.
$3$. Area $A_3$ (trapezium from $t=2$ to $t=3$): $\frac{1}{2} \times (\text{sum of parallel sides}) \times \text{height} = \frac{1}{2} \times (20 + 10) \times 1 = 15 \; m$.
$4$. Area $A_4$ (rectangle from $t=3$ to $t=4$): $\text{length} \times \text{breadth} = 1 \times 10 = 10 \; m$.
Total distance = $A_1 + A_2 + A_3 + A_4 = 10 + 20 + 15 + 10 = 55 \; m$.
0 likes
View Solution9
EasyMCQ
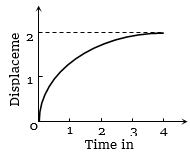
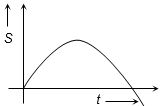
The displacement of a particle as a function of time is shown in the figure. The figure shows that
A
The particle starts with certain velocity but the motion is retarded and finally the particle stops
B
The velocity of the particle is constant throughout
C
The acceleration of the particle is constant throughout.
D
The particle starts with constant velocity,then motion is accelerated and finally the particle moves with another constant velocity
Solution
(A) The slope of the displacement-time graph represents the velocity of the particle $(v = dx/dt)$.
As time increases,the slope of the curve continuously decreases,which indicates that the velocity of the particle is decreasing.
This means the motion is retarded (decelerated).
Finally,the slope of the curve becomes zero at the horizontal asymptote,which implies that the velocity becomes zero and the particle stops.
Therefore,option $(A)$ is correct.
0 likes
View Solution10
MediumMCQ
$A$ ball is thrown vertically upwards. Which of the following graphs represents the velocity-time graph of the ball during its flight (air resistance is neglected)?
A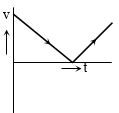
B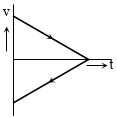
C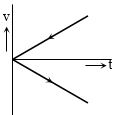
D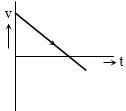
Solution
(D) When a ball is thrown vertically upwards with an initial velocity $u$,it moves under the influence of constant gravitational acceleration $g$ acting downwards.
According to the equation of motion,$v = u - gt$.
$1$. During the upward journey,the velocity is positive and decreases linearly with time until it becomes zero at the maximum height.
$2$. At the maximum height,the velocity is zero.
$3$. During the downward journey,the velocity becomes negative (as it is directed downwards) and its magnitude increases linearly with time.
$4$. The slope of the velocity-time graph is $-g$,which is constant throughout the motion.
Therefore,the graph is a straight line with a negative slope passing through the positive velocity axis,crossing the time axis,and continuing into the negative velocity region. This corresponds to the graph shown in option $D$.
0 likes
View Solution11
MediumMCQ
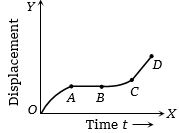
The graph between the displacement $x$ and time $t$ for a particle moving in a straight line is shown in the figure. Determine the sign of the acceleration of the particle for the intervals $OA$,$AB$,$BC$,and $CD$ respectively.
A
$+, 0, +, +$
B
$-, 0, +, 0$
C
$+, 0, -, +$
D
$-, 0, -, 0$
Solution
(B) The acceleration of a particle is given by the second derivative of displacement with respect to time,$a = \frac{d^2x}{dt^2}$,which corresponds to the concavity of the $x-t$ graph.
$1$. Region $OA$: The graph is concave downwards (bending towards the time axis). The slope (velocity) is decreasing,so the acceleration is negative $(-)$.
$2$. Region $AB$: The graph is a straight line parallel to the time axis. The slope (velocity) is constant and zero. Therefore,the acceleration is zero $(0)$.
$3$. Region $BC$: The graph is concave upwards (bending towards the displacement axis). The slope (velocity) is increasing,so the acceleration is positive $(+)$.
$4$. Region $CD$: The graph is a straight line with a constant non-zero slope. Since the velocity is constant,the acceleration is zero $(0)$.
Thus,the signs of acceleration for $OA, AB, BC, CD$ are $-, 0, +, 0$ respectively. The correct option is $(b)$.
0 likes
View Solution12
MediumMCQ
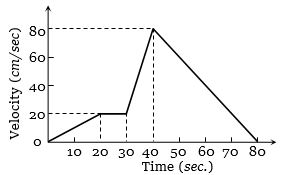
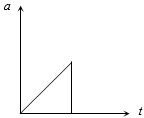
The $v - t$ graph of a moving object is given in the figure. The maximum acceleration is .......... $cm/sec^{2}$.
A
$1$
B
$2$
C
$3$
D
$6$
Solution
(D) Maximum acceleration corresponds to the steepest slope of the $v - t$ graph,which represents the maximum rate of change of velocity.
$1$. For the interval $t = 0$ to $t = 20 \, sec$: $a = \frac{20 - 0}{20 - 0} = 1 \, cm/sec^2$.
$2$. For the interval $t = 20$ to $t = 30 \, sec$: $a = 0 \, cm/sec^2$ (constant velocity).
$3$. For the interval $t = 30$ to $t = 40 \, sec$: $a = \frac{80 - 20}{40 - 30} = \frac{60}{10} = 6 \, cm/sec^2$.
$4$. For the interval $t = 40$ to $t = 80 \, sec$: $a = \frac{0 - 80}{80 - 40} = \frac{-80}{40} = -2 \, cm/sec^2$.
Comparing the magnitudes of acceleration in all intervals,the maximum acceleration is $6 \, cm/sec^2$. Thus,the correct option is $D$.
1 likes
View Solution13
MediumMCQ
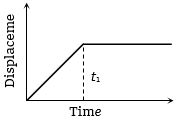
The $x - t$ graph shown in the figure represents:
A
Constant velocity
B
Velocity of the body is continuously changing
C
Instantaneous velocity
D
The body travels with constant speed up to time $t_1$ and then stops
Solution
(D) In an $x - t$ (displacement-time) graph,the slope represents the velocity of the body.
For $t < t_1$,the graph is a straight line with a constant positive slope,which indicates that the body is moving with a constant velocity.
For $t > t_1$,the graph is a horizontal line,meaning the slope is zero. This indicates that the displacement of the body is not changing,so the velocity is zero (the body is at rest).
Therefore,the body travels with a constant speed up to time $t_1$ and then stops.
0 likes
View Solution14
MediumMCQ
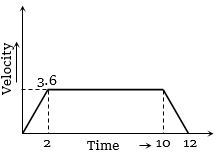
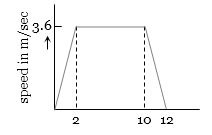
$A$ lift is going up. The variation in the velocity of the lift is given in the graph. What is the height to which the lift takes the passengers? (in $m$)
A
$3.6$
B
$28.8$
C
$36$
D
Cannot be calculated from the above graph
Solution
(C) The total height (displacement) reached by the lift is equal to the area under the velocity-time graph.
The graph is a trapezium with parallel sides of lengths $10 - 2 = 8$ and $12 - 0 = 12$, and a height (velocity) of $3.6$.
Area of trapezium $= \frac{1}{2} \times (\text{sum of parallel sides}) \times (\text{height})$
Area $= \frac{1}{2} \times (8 + 12) \times 3.6$
Area $= \frac{1}{2} \times 20 \times 3.6 = 10 \times 3.6 = 36\,m$.
0 likes
View Solution15
MediumMCQ
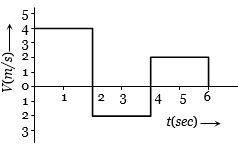
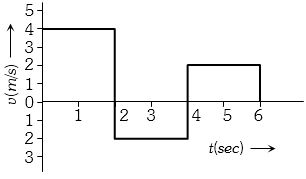
The velocity-time graph of a body moving in a straight line is shown in the figure. The displacement and distance travelled by the body in $6 \, s$ are respectively:
A
$8 \, m, 16 \, m$
B
$16 \, m, 8 \, m$
C
$16 \, m, 16 \, m$
D
$8 \, m, 8 \, m$
Solution
(A) Displacement is the algebraic sum of the areas under the velocity-time graph.
Displacement $= A_1 + (-A_2) + A_3$
$= (2 \, s \times 4 \, m/s) + (2 \, s \times -2 \, m/s) + (2 \, s \times 2 \, m/s)$
$= 8 \, m - 4 \, m + 4 \, m = 8 \, m$
Distance is the sum of the magnitudes of the areas under the velocity-time graph.
Distance $= |A_1| + |A_2| + |A_3|$
$= |8 \, m| + |-4 \, m| + |4 \, m|$
$= 8 \, m + 4 \, m + 4 \, m = 16 \, m$
Thus,the displacement is $8 \, m$ and the distance is $16 \, m$.
0 likes
View Solution16
MediumMCQ
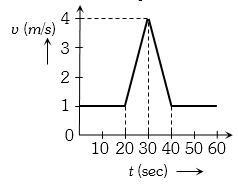
The velocity-time $(v-t)$ graph for a moving object is shown in the figure. The total displacement of the object during the time interval when there is non-zero acceleration and retardation is ........ $m$.
A
$60$
B
$50$
C
$30$
D
$40$
Solution
(B) The interval with non-zero acceleration and retardation is from $t = 20 \, s$ to $t = 40 \, s$.
Displacement is equal to the area under the $v-t$ graph.
For the interval $t = 20 \, s$ to $t = 40 \, s$,the area consists of a rectangle of height $1 \, m/s$ and width $20 \, s$,plus a triangle of base $20 \, s$ and height $(4 - 1) = 3 \, m/s$.
Area $= (20 \times 1) + (\frac{1}{2} \times 20 \times 3)$
Area $= 20 + 30 = 50 \, m$.
0 likes
View Solution17
MediumMCQ
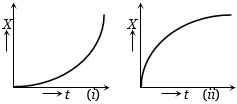
Figures $(i)$ and $(ii)$ below show the displacement-time graphs of two particles moving along the x-axis. We can say that
A
Both the particles are having a uniformly accelerated motion
B
Both the particles are having a uniformly retarded motion
C
Particle $(i)$ is having a uniformly accelerated motion while particle $(ii)$ is having a uniformly retarded motion
D
Particle $(i)$ is having a uniformly retarded motion while particle $(ii)$ is having a uniformly accelerated motion
Solution
(C) The displacement-time equation for uniform acceleration is given by $x = x_0 + u t + \frac{1}{2} a t^2$.
For a particle starting from rest $(u=0)$,this simplifies to $x = x_0 + \frac{1}{2} a t^2$,which represents a parabolic curve.
In figure $(i)$,the slope of the displacement-time graph (which represents velocity) increases with time,indicating that the particle is undergoing uniformly accelerated motion.
In figure $(ii)$,the slope of the displacement-time graph decreases with time,indicating that the particle is undergoing uniformly retarded (decelerated) motion.
Therefore,particle $(i)$ is having a uniformly accelerated motion while particle $(ii)$ is having a uniformly retarded motion.
0 likes
View Solution18
MediumMCQ
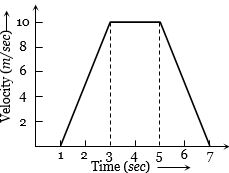
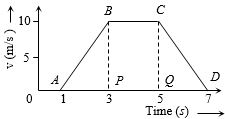
For the velocity-time graph shown in the figure,what fraction of the total distance covered in all seven seconds is the distance covered by the body in the last two seconds of its motion?
A
$0.5$
B
$0.25$
C
$0.33$
D
$0.67$
Solution
(B) The distance covered by an object in a velocity-time graph is equal to the area under the graph.
$1$. Total distance covered in $7 \text{ s}$ (Area of the trapezium):
$\text{Area} = \frac{1}{2} \times (\text{sum of parallel sides}) \times \text{height}$
$\text{Area} = \frac{1}{2} \times (7 - 1 + 5 - 3) \times 10 = \frac{1}{2} \times (6 + 2) \times 10 = \frac{1}{2} \times 8 \times 10 = 40 \text{ m}$.
$2$. Distance covered in the last $2 \text{ s}$ (from $t = 5 \text{ s}$ to $t = 7 \text{ s}$):
This is the area of the triangle formed between $t = 5$ and $t = 7$.
$\text{Area} = \frac{1}{2} \times \text{base} \times \text{height} = \frac{1}{2} \times (7 - 5) \times 10 = \frac{1}{2} \times 2 \times 10 = 10 \text{ m}$.
$3$. Required fraction:
$\text{Fraction} = \frac{\text{Distance in last } 2 \text{ s}}{\text{Total distance}} = \frac{10}{40} = 0.25$.
0 likes
View Solution19
EasyMCQ
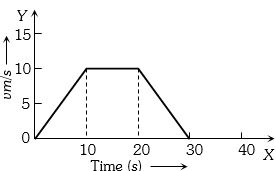
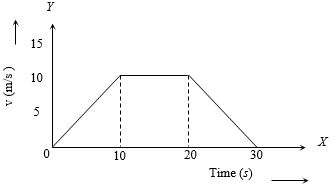
In the following velocity-time graph,the distance travelled by the body in metres is ............. $m$.
A
$200$
B
$250$
C
$300$
D
$400$
Solution
(A) The distance travelled by a body in a velocity-time graph is equal to the area under the velocity-time curve.
Here,the shape under the graph is a trapezium with parallel sides of length $10 \; s$ (from $10 \; s$ to $20 \; s$) and $30 \; s$ (from $0 \; s$ to $30 \; s$),and a height of $10 \; m/s$.
Area of trapezium $= \frac{1}{2} \times (\text{sum of parallel sides}) \times \text{height}$
Distance $= \frac{1}{2} \times (10 + 30) \times 10$
Distance $= \frac{1}{2} \times 40 \times 10 = 200 \; m$.
0 likes
View Solution20
EasyMCQ
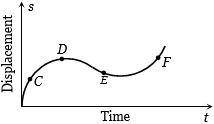
The displacement-time graph of a moving particle is shown below. The instantaneous velocity of the particle is negative at the point:
A
$D$
B
$F$
C
$C$
D
$E$
Solution
(D) The instantaneous velocity of a particle is given by the slope of the displacement-time graph at that point.
Mathematically,$v = \frac{ds}{dt}$.
- At point $C$,the slope is positive as the displacement is increasing.
- At point $D$,the slope is zero because it is at the peak of the curve.
- At point $E$,the slope is negative because the displacement is decreasing with time.
- At point $F$,the slope is positive as the displacement is increasing again.
Therefore,the instantaneous velocity is negative at point $E$.
0 likes
View Solution21
EasyMCQ
Which of the following graphs represents uniform motion?
A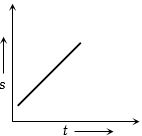
B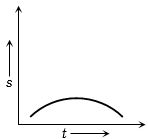
C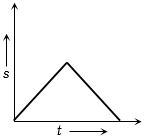
D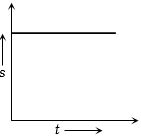
Solution
(A) Uniform motion is defined as motion where an object covers equal distances in equal intervals of time. In a position-time $(s-t)$ graph,this corresponds to a straight line with a constant slope,as the velocity $(v = \frac{ds}{dt})$ remains constant. Graph $(A)$ shows a linear relationship between position and time,indicating a constant velocity,which represents uniform motion.
0 likes
View Solution22
MediumMCQ
The graph of displacement $s$ versus time $t$ is given below. Its corresponding velocity-time graph will be:
A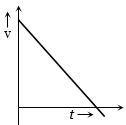
B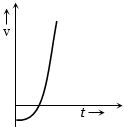
C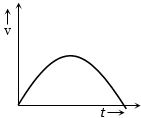
D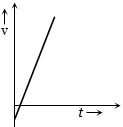
Solution
(A) The velocity $v$ of a body is given by the slope of the displacement-time graph,i.e.,$v = \frac{ds}{dt}$.
$1$. Initially,the slope of the displacement-time graph is positive and decreasing,which means the velocity is positive and decreasing.
$2$. At the peak of the graph,the slope is zero,so the velocity is zero.
$3$. After the peak,the slope becomes negative,which means the velocity becomes negative.
$4$. Among the given options,the graph that shows velocity starting from a positive value,decreasing to zero,and then becoming negative is represented by option $A$.
0 likes
View Solution23
EasyMCQ
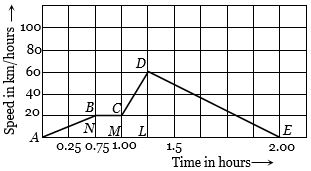
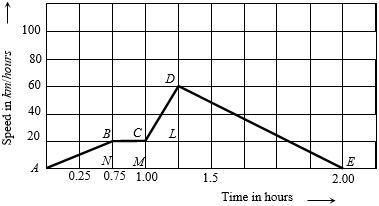
$A$ train moves from one station to another in $2$ hours. Its speed-time graph during this motion is shown in the figure. The maximum acceleration during the journey is ............. $km\, h^{-2}$.
A
$140$
B
$160$
C
$100$
D
$120$
Solution
(B) The acceleration is given by the slope of the speed-time graph.
For part $AB$: Slope $= \frac{20 - 0}{0.75 - 0} = \frac{20}{0.75} \approx 26.67 \; km\, h^{-2}$.
For part $BC$: Slope $= 0$ (constant speed).
For part $CD$: Slope $= \frac{60 - 20}{1.25 - 1.00} = \frac{40}{0.25} = 160 \; km\, h^{-2}$.
For part $DE$: Slope $= \frac{0 - 60}{2.00 - 1.25} = \frac{-60}{0.75} = -80 \; km\, h^{-2}$ (deceleration).
Comparing these values,the maximum acceleration is $160 \; km\, h^{-2}$,which corresponds to the segment $CD$.
0 likes
View Solution24
EasyMCQ
The area under an acceleration-time graph gives:
A
Distance travelled
B
Change in acceleration
C
Force acting
D
Change in velocity
Solution
(D) The correct option is $D$.
By definition,acceleration $a$ is the rate of change of velocity with respect to time,given by the formula $a = \frac{dv}{dt}$.
Rearranging this equation,we get $dv = a \cdot dt$.
To find the total change in velocity over a time interval from $t_1$ to $t_2$,we integrate both sides: $\Delta v = \int_{t_1}^{t_2} a \cdot dt$.
Geometrically,the integral $\int a \cdot dt$ represents the area under the acceleration-time graph.
Therefore,the area under the acceleration-time graph gives the change in velocity of the object.
0 likes
View Solution25
EasyMCQ
Which of the following position-time $(s-t)$ graphs represents uniform acceleration?
A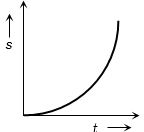
B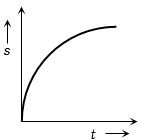
C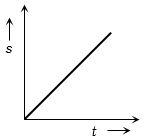
D
Solution
(A) For uniform acceleration,the equation of motion is given by $s = ut + \frac{1}{2}at^2$.
If the initial velocity $u = 0$,then $s = \frac{1}{2}at^2$.
This equation represents a parabola where $s \propto t^2$.
Graph $(A)$ shows a parabolic curve,which is characteristic of motion with constant (uniform) acceleration.
If the initial velocity $u = 0$,then $s = \frac{1}{2}at^2$.
This equation represents a parabola where $s \propto t^2$.
Graph $(A)$ shows a parabolic curve,which is characteristic of motion with constant (uniform) acceleration.
0 likes
View Solution26
EasyMCQ
Which of the following velocity-time graphs shows a realistic situation for a body in motion?
A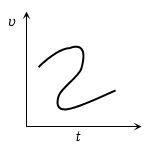
B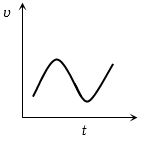
C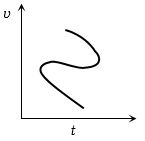
D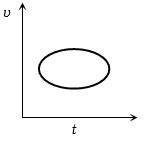
Solution
(B) For a body in motion,at any single instant of time $t$,there can be only one unique value of velocity $v$.
In graphs $A$,$C$,and $D$,for a single value of time $t$,the graph shows multiple values of velocity $v$,which is physically impossible.
Graph $B$ represents a realistic situation where the velocity varies continuously with time,having a unique value for every instant $t$.
In graphs $A$,$C$,and $D$,for a single value of time $t$,the graph shows multiple values of velocity $v$,which is physically impossible.
Graph $B$ represents a realistic situation where the velocity varies continuously with time,having a unique value for every instant $t$.
0 likes
View Solution27
EasyMCQ
Which of the following velocity-time graphs represents uniform motion?
A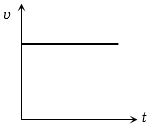
B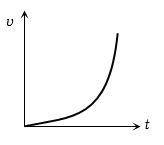
C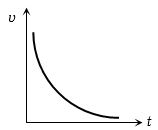
D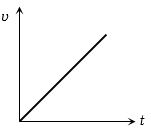
Solution
(A) Uniform motion is defined as motion with a constant velocity,meaning the acceleration is zero $(a = 0)$.
In a velocity-time $(v-t)$ graph,the slope represents acceleration.
For graph $(A)$,the velocity remains constant over time,resulting in a horizontal line parallel to the time axis. The slope of this line is zero,which implies $a = 0$. Therefore,graph $(A)$ represents uniform motion.
Graphs $(B)$,$(C)$,and $(D)$ represent non-uniform motion because their slopes are non-zero or changing,indicating acceleration.
0 likes
View Solution28
MediumMCQ
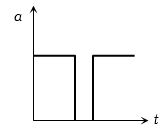
The acceleration-time graph of a body is shown. The corresponding velocity-time graph of the same body is
A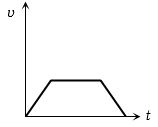
B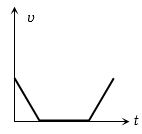
C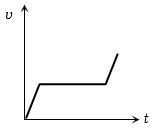
D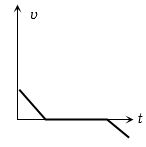
Solution
(D) From the acceleration-time graph,we can observe three distinct phases of motion:
$1$. In the first phase,the acceleration $a$ is constant and positive. Since $v = \int a \, dt$,the velocity increases linearly with time,represented by a straight line with a positive slope on a velocity-time graph.
$2$. In the second phase,the acceleration $a = 0$. This means the velocity remains constant,represented by a horizontal line on a velocity-time graph.
$3$. In the third phase,the acceleration $a$ is again constant and positive. This means the velocity increases linearly with time again,represented by a straight line with a positive slope.
Comparing this with the given options,the graph that shows a linear increase in velocity,followed by a constant velocity,and then another linear increase is option $D$.
0 likes
View Solution29
DifficultMCQ
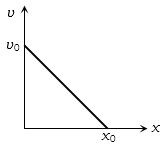
The given graph shows the variation of velocity $v$ with displacement $x$. Which one of the graphs given below correctly represents the variation of acceleration $a$ with displacement $x$?
A
B
C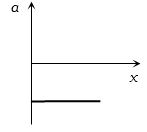
D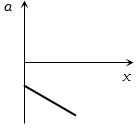
Solution
(B) The given graph is a straight line with a positive intercept $v_0$ and a negative slope. The equation of the line is given by:
$v = -mx + v_0$ ... $(i)$
where $m = \tan \theta = \frac{v_0}{x_0}$ is the magnitude of the slope.
We know that acceleration $a = v \frac{dv}{dx}$.
From equation $(i)$,differentiating with respect to $x$ gives:
$\frac{dv}{dx} = -m$
Substituting this into the acceleration formula:
$a = (-mx + v_0)(-m)$
$a = m^2x - mv_0$
This is the equation of a straight line with a positive slope $(m^2)$ and a negative intercept $(-mv_0)$ on the $a$-axis.
Comparing this with the given options,Graph $B$ represents a straight line with a negative intercept on the $a$-axis and a positive slope. Therefore,Graph $B$ is correct.
0 likes
View Solution30
DifficultMCQ
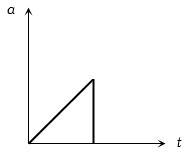
The acceleration-time graph of a body is shown below. The most probable velocity-time graph of the body is:
A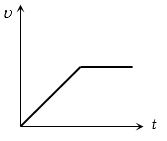
B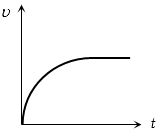
C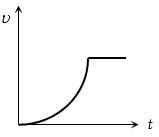
D
Solution
(D) From the given $a-t$ graph,it is clear that the acceleration is increasing at a constant rate.
$\therefore \frac{da}{dt} = k$ (constant) $\implies a = kt$ (by integration).
Since $a = \frac{dv}{dt}$,we have $\frac{dv}{dt} = kt \implies dv = kt \, dt$.
Integrating both sides: $\int dv = \int kt \, dt \implies v = \frac{1}{2}kt^2$.
This shows that $v$ is dependent on time parabolically,where the graph is a parabola opening upwards.
After the acceleration reaches its maximum value,it suddenly becomes zero. When acceleration is zero,the velocity of the body becomes constant.
Therefore,the velocity-time graph will show a parabolic increase followed by a horizontal line representing constant velocity. This corresponds to graph $(d)$.
0 likes
View Solution31
EasyMCQ
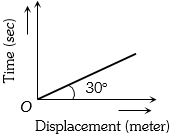
From the following displacement-time graph,find the velocity of a moving body.
A
$\frac{1}{\sqrt{3}} \, m/s$
B
$3 \, m/s$
C
$\sqrt{3} \, m/s$
D
$\frac{1}{3} \, m/s$
Solution
(C) The slope of a displacement-time graph gives the velocity. However,the slope is defined as $\tan \theta$,where $\theta$ is the angle made by the line with the time axis.
In the given graph,the angle $30^{\circ}$ is made with the displacement axis.
The angle with the time axis is $\theta = 90^{\circ} - 30^{\circ} = 60^{\circ}$.
Therefore,the velocity $v = \tan(60^{\circ}) = \sqrt{3} \, m/s$.
In the given graph,the angle $30^{\circ}$ is made with the displacement axis.
The angle with the time axis is $\theta = 90^{\circ} - 30^{\circ} = 60^{\circ}$.
Therefore,the velocity $v = \tan(60^{\circ}) = \sqrt{3} \, m/s$.
0 likes
View Solution32
MediumMCQ
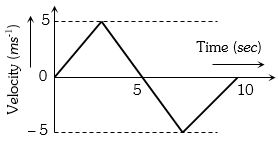
The $v-t$ plot of a moving object is shown in the figure. The average velocity of the object during the first $10$ seconds is...........$m/s$.
A
$0$
B
$2.5$
C
$5$
D
$2$
Solution
(A) The average velocity is defined as the total displacement divided by the total time interval.
In a $v-t$ graph,the displacement is equal to the area under the curve.
For the interval $t = 0$ to $t = 5$ seconds,the area is a triangle with base $5$ and height $5$,so displacement $s_1 = \frac{1}{2} \times 5 \times 5 = 12.5 \ m$.
For the interval $t = 5$ to $t = 10$ seconds,the area is a triangle with base $5$ and height $-5$,so displacement $s_2 = \frac{1}{2} \times 5 \times (-5) = -12.5 \ m$.
Total displacement $s = s_1 + s_2 = 12.5 + (-12.5) = 0 \ m$.
Average velocity = $\frac{\text{Total displacement}}{\text{Total time}} = \frac{0}{10} = 0 \ m/s$.
0 likes
View Solution33
MediumMCQ
$A$ lift is going up. The total mass of the lift and the passenger is $1500\, kg$. The variation in the speed of the lift is as given in the graph. The height to which the lift takes the passenger is ............ $m$.
A
$3.6$
B
$8$
C
$1.8$
D
$36$
Solution
(D) The distance traveled by the lift is equal to the area under the velocity-time graph.
The graph is a trapezium with parallel sides of lengths $12\, s$ and $(10 - 2) = 8\, s$,and a height of $3.6\, m/s$.
Alternatively,the area can be calculated as the sum of the areas of two triangles and one rectangle:
Area $= (\text{Area of first triangle}) + (\text{Area of rectangle}) + (\text{Area of second triangle})$
Area $= (\frac{1}{2} \times 2 \times 3.6) + (8 \times 3.6) + (\frac{1}{2} \times 2 \times 3.6)$
Area $= 3.6 + 28.8 + 3.6 = 36\, m$.
Thus,the total height reached by the lift is $36\, m$.
0 likes
View Solution34
MediumMCQ
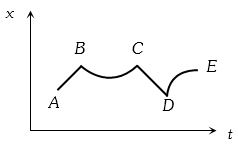
The figure shows the displacement of a particle moving along the $X-$axis as a function of time. The force acting on the particle is zero in the region:
A
$AB$
B
$BC$
C
$CD$
D
Both $(a)$ and $(c)$
Solution
(D) According to Newton's first law of motion,if the net force acting on a particle is zero,it moves with a constant velocity.
In a displacement-time $(x-t)$ graph,the velocity is represented by the slope of the graph.
If the slope is constant,the velocity is constant,which implies that the acceleration is zero and the net force acting on the particle is zero.
In the given graph,the segments $AB$ and $CD$ are straight lines,meaning the slope (velocity) is constant in these regions.
Therefore,the force acting on the particle is zero in regions $AB$ and $CD$.
0 likes
View Solution35
MediumMCQ
$A$ batsman hits a sixer and the ball touches the ground outside the cricket ground. Which of the following graphs describes the variation of the cricket ball's vertical velocity $v$ with time between the time $t_1$ as it hits the bat and time $t_2$ when it touches the ground?
A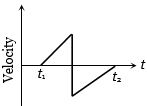
B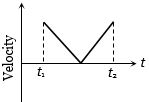
C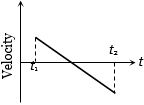
D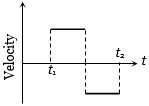
Solution
(C) When a batsman hits a ball,it moves upward with an initial vertical velocity. Under the influence of gravity,its vertical velocity decreases linearly with time until it reaches the highest point of its trajectory,where the vertical velocity becomes zero. After this point,the ball starts moving downward,and its vertical velocity increases in the downward direction (which is represented as negative velocity). The acceleration due to gravity $g$ is constant and acts downwards throughout the motion,meaning the slope of the velocity-time graph $(dv/dt = -g)$ is constant and negative. This linear decrease in velocity from a positive value to a negative value is correctly represented by graph $C$.
0 likes
View Solution36
DifficultMCQ
The position $x$ of a particle moving in one dimension under the influence of a constant force is given by $t = \sqrt{x} + 3$,where $x$ is in meters and $t$ is in seconds. Find the displacement of the particle in $m$ when its velocity becomes zero.
A
$-9$
B
$3$
C
$6$
D
$9$
Solution
(D) Given equation: $t = \sqrt{x} + 3$
Rearranging for $x$: $\sqrt{x} = t - 3$
Squaring both sides: $x = (t - 3)^2$
Velocity $v$ is the derivative of position with respect to time: $v = \frac{dx}{dt} = \frac{d}{dt}(t - 3)^2 = 2(t - 3)$
When velocity is zero: $2(t - 3) = 0 \implies t = 3 \text{ s}$
Position at $t = 3 \text{ s}$: $x = (3 - 3)^2 = 0 \text{ m}$
Initial position at $t = 0 \text{ s}$: $x_0 = (0 - 3)^2 = 9 \text{ m}$
Displacement $\Delta x = x - x_0 = 0 - 9 = -9 \text{ m}$
The magnitude of displacement is $9 \text{ m}$.
0 likes
View Solution37
MediumMCQ
$A$ particle moves according to the equation $x = a + bt^2$,where $a = 15 \, cm$ and $b = 3 \, cm/s^2$. What is the velocity of the particle at $t = 3 \, s$ in $cm/s$?
A
$36$
B
$18$
C
$16$
D
$32$
Solution
(B) The position of the particle is given by $x = a + bt^2$.
The velocity $v$ is the time derivative of the position $x$:
$v = \frac{dx}{dt} = \frac{d}{dt}(a + bt^2)$
Since $a$ is a constant,its derivative is $0$:
$v = 0 + 2bt = 2bt$
Given $b = 3 \, cm/s^2$ and $t = 3 \, s$:
$v = 2 \times 3 \times 3$
$v = 18 \, cm/s$.
The velocity $v$ is the time derivative of the position $x$:
$v = \frac{dx}{dt} = \frac{d}{dt}(a + bt^2)$
Since $a$ is a constant,its derivative is $0$:
$v = 0 + 2bt = 2bt$
Given $b = 3 \, cm/s^2$ and $t = 3 \, s$:
$v = 2 \times 3 \times 3$
$v = 18 \, cm/s$.
0 likes
View Solution38
MediumMCQ
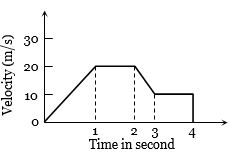
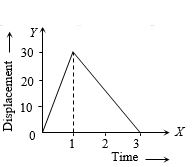
What is the ratio of the velocity in the first $1 \ s$ to the velocity in the next $2 \ s$ based on the given displacement-time graph?
A
$1:2$
B
$1:3$
C
$3:1$
D
$2:1$
Solution
(D) The velocity is given by the slope of the displacement-time graph.
For the first $1 \ s$ ($t=0$ to $t=1$):
$v_1 = \frac{\Delta x}{\Delta t} = \frac{30 - 0}{1 - 0} = 30 \ m/s$.
For the next $2 \ s$ ($t=1$ to $t=3$):
$v_2 = \frac{\Delta x}{\Delta t} = \frac{0 - 30}{3 - 1} = \frac{-30}{2} = -15 \ m/s$.
The magnitude of velocity in the next $2 \ s$ is $|v_2| = 15 \ m/s$.
The ratio of the velocity in the first $1 \ s$ to the magnitude of velocity in the next $2 \ s$ is $\frac{30}{15} = \frac{2}{1}$,which is $2:1$.
0 likes
View Solution39
DifficultMCQ
What is the maximum acceleration of the train during the journey in $km \ h^{-2}$?
A
$140$
B
$160$
C
$100$
D
$120$
Solution
(B) The acceleration is given by the slope of the speed-time graph.
For segment $AB$: $a_1 = \frac{20 - 0}{0.75 - 0} = \frac{20}{0.75} \approx 26.67 \ km \ h^{-2}$.
For segment $BC$: $a_2 = 0 \ km \ h^{-2}$ (constant speed).
For segment $CD$: $a_3 = \frac{60 - 20}{1.25 - 1.00} = \frac{40}{0.25} = 160 \ km \ h^{-2}$.
For segment $DE$: $a_4 = \frac{0 - 60}{2.00 - 1.25} = \frac{-60}{0.75} = -80 \ km \ h^{-2}$.
Comparing these values,the maximum acceleration is $160 \ km \ h^{-2}$.
0 likes
View Solution40
DifficultMCQ
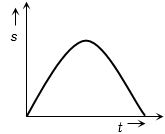
For the given displacement-time graph,what will the corresponding velocity-time graph look like?
A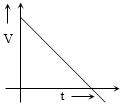
B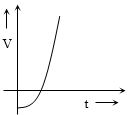
C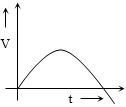
D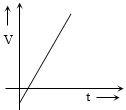
Solution
(A) The velocity $v$ is given by the slope of the displacement-time $(s-t)$ graph,i.e.,$v = \frac{ds}{dt}$.
In the given $s-t$ graph,the curve is a parabola opening downwards,which can be represented by the equation $s = at - bt^2$,where $a$ and $b$ are positive constants.
Differentiating this with respect to time $t$,we get the velocity $v = \frac{ds}{dt} = a - 2bt$.
This equation $v = a - 2bt$ represents a straight line with a negative slope $(-2b)$ and a positive intercept $(a)$ on the velocity axis.
Thus,the velocity-time graph is a straight line with a negative slope,which matches the graph shown in option $A$.
0 likes
View Solution41
DifficultMCQ
$A$ lift is moving upwards. Its velocity-time graph is given. The distance covered by the lift is ........ $m$.
A
$200$
B
$250$
C
$300$
D
$400$
Solution
(A) The distance covered by an object is equal to the area under the velocity-time $(v-t)$ graph.
The graph is a trapezium with parallel sides of lengths $30 \ s$ and $(20 - 10) = 10 \ s$,and a height of $10 \ m/s$.
Area = $\frac{1}{2} \times (\text{sum of parallel sides}) \times \text{height}$
Area = $\frac{1}{2} \times (30 + 10) \times 10$
Area = $\frac{1}{2} \times 40 \times 10 = 200 \ m$.
Therefore,the distance covered by the lift is $200 \ m$.
0 likes
View Solution42
DifficultMCQ
The distance covered by the particle in the last $2\,s$ is what fraction of the total distance covered by it in $7\,s$?
A
$0.5$
B
$0.25$
C
$0.33$
D
$0.67$
Solution
(B) The distance covered is equal to the area under the velocity-time graph.
Total distance covered in $7\,s$ is the area of the trapezium $ABCD$:
Area $= \frac{1}{2} \times (\text{sum of parallel sides}) \times \text{height}$
Area $= \frac{1}{2} \times (6 + 2) \times 10 = \frac{1}{2} \times 8 \times 10 = 40\,m$.
Distance covered in the last $2\,s$ (from $t = 5\,s$ to $t = 7\,s$) is the area of the triangle $CQD$:
Area $= \frac{1}{2} \times \text{base} \times \text{height}$
Area $= \frac{1}{2} \times (7 - 5) \times 10 = \frac{1}{2} \times 2 \times 10 = 10\,m$.
The required fraction is $\frac{10}{40} = 0.25$.
0 likes
View Solution43
DifficultMCQ
The acceleration-time graph for a particle is given. What will be the corresponding velocity-time graph?
A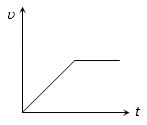
B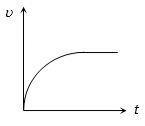
C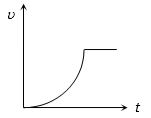
D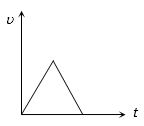
Solution
(B) The given acceleration-time $(a-t)$ graph shows that acceleration increases linearly with time $(a \propto t)$ for a certain interval and then becomes zero (or drops to zero).
$1$. For the interval where acceleration increases linearly: $a = kt$ (where $k$ is a constant).
Since $a = \frac{dv}{dt}$,we have $\frac{dv}{dt} = kt$.
Integrating both sides with respect to time: $\int dv = \int kt \, dt$.
This gives $v = \frac{1}{2} kt^2 + C$. Since the graph starts from the origin,$C = 0$,so $v = \frac{1}{2} kt^2$.
This represents a parabolic curve opening upwards.
$2$. When the acceleration becomes zero,the velocity becomes constant (as $\frac{dv}{dt} = 0$).
Therefore,the velocity-time graph should show a parabolic increase followed by a horizontal line representing constant velocity. This matches the graph in option $B$.
0 likes
View Solution44
MediumMCQ
Which of the following velocity-time graphs is physically not possible?
A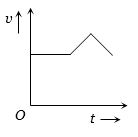
B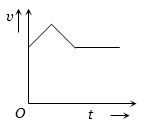
C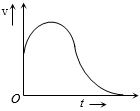
D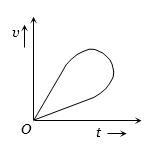
Solution
(D) In a velocity-time graph,the velocity $v$ is represented on the $y$-axis and time $t$ on the $x$-axis.
For a graph to be physically possible,for every instant of time $t$,there must be a unique value of velocity $v$.
In graph $D$,for a single instant of time $t$,there are two different values of velocity $v$,which is physically impossible.
Therefore,graph $D$ is not possible.
For a graph to be physically possible,for every instant of time $t$,there must be a unique value of velocity $v$.
In graph $D$,for a single instant of time $t$,there are two different values of velocity $v$,which is physically impossible.
Therefore,graph $D$ is not possible.
0 likes
View Solution45
MediumMCQ
If a steel ball is dropped from a height onto a marble floor,what will the velocity-time graph look like?
A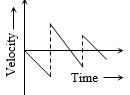
B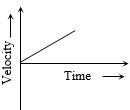
C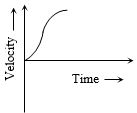
D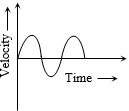
Solution
(A) When a steel ball is dropped from a height,it accelerates downwards due to gravity,so its velocity increases in the negative direction (downward). This is represented by a straight line with a negative slope starting from the origin.
When it hits the marble floor,it undergoes an elastic collision,causing an instantaneous change in the direction of velocity from negative to positive. This is represented by a vertical jump in the graph.
After the bounce,it moves upwards with a positive velocity that decreases due to gravity,represented by a straight line with a negative slope in the positive velocity region.
As the ball continues to bounce,the height of each subsequent bounce decreases due to energy loss,resulting in smaller velocity changes and shorter time intervals between bounces. This pattern of linear segments with negative slopes and vertical jumps is correctly depicted in option $A$.
0 likes
View Solution46
MediumMCQ
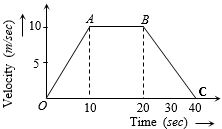
What is the acceleration of the particle on $OA$,$AB$,and $BC$ respectively?
A
$1, 0, -0.5$
B
$1, 0, 0.5$
C
$1, 1, 0.5$
D
$1, 0.5, 0$
Solution
(A) The acceleration is given by the slope of the velocity-time graph.
For segment $OA$: Acceleration $a_{OA} = \frac{v_A - v_O}{t_A - t_O} = \frac{10 - 0}{10 - 0} = 1 \ m/s^2$.
For segment $AB$: Since velocity is constant,acceleration $a_{AB} = 0 \ m/s^2$.
For segment $BC$: Acceleration $a_{BC} = \frac{v_C - v_B}{t_C - t_B} = \frac{0 - 10}{40 - 20} = \frac{-10}{20} = -0.5 \ m/s^2$.
Thus,the accelerations are $1, 0, -0.5$.
0 likes
View Solution47
MediumMCQ
The position $x$ of a particle with respect to time $t$ along the $x$-axis is given by $x = 9t^2 - t^3$,where $x$ is in metres and $t$ is in seconds. What will be the position of this particle when it achieves maximum speed along the $x$-direction?
A
$54$
B
$81$
C
$24$
D
$32$
Solution
(A) Given the position equation: $x = 9t^2 - t^3$.
Velocity $v$ is the derivative of position with respect to time: $v = \frac{dx}{dt} = \frac{d}{dt}(9t^2 - t^3) = 18t - 3t^2$.
To find the time at which speed is maximum,we differentiate velocity with respect to time and set it to zero: $\frac{dv}{dt} = 18 - 6t = 0$.
Solving for $t$,we get $t = 3 \ s$.
Now,substitute $t = 3 \ s$ into the position equation to find the position at that instant: $x = 9(3)^2 - (3)^3 = 9(9) - 27 = 81 - 27 = 54 \ m$.
1 likes
View Solution48
DifficultMCQ
$A$ particle of unit mass undergoes one-dimensional motion such that its velocity varies according to $v(x) = \beta x^{-2n}$,where $\beta$ and $n$ are constants and $x$ is the position of the particle. The acceleration of the particle as a function of $x$ is given by:
A
$-2n \beta^2 x^{-2n-1}$
B
$-2n \beta^2 x^{-4n-1}$
C
$-2n \beta^2 x^{-2n+1}$
D
$-2n \beta^2 x^{-4n+1}$
Solution
(B) The velocity of the particle is given as $v(x) = \beta x^{-2n}$.
To find the acceleration $a$,we use the relation $a = v \frac{dv}{dx}$.
First,differentiate $v$ with respect to $x$:
$\frac{dv}{dx} = \frac{d}{dx} (\beta x^{-2n}) = \beta (-2n) x^{-2n-1} = -2n \beta x^{-2n-1}$.
Now,substitute $v$ and $\frac{dv}{dx}$ into the acceleration formula:
$a = (\beta x^{-2n}) \times (-2n \beta x^{-2n-1})$.
$a = -2n \beta^2 x^{-2n + (-2n) - 1}$.
$a = -2n \beta^2 x^{-4n-1}$.
0 likes
View Solution49
MediumMCQ
Two cars $P$ and $Q$ start from a point at the same time in a straight line and their positions are represented by $x_P(t) = at + bt^2$ and $x_Q(t) = ft - t^2$. At what time do the cars have the same velocity?
A
$\frac{a + f}{2(1 + b)}$
B
$\frac{f - a}{2(1 + b)}$
C
$\frac{a + f}{1 + b}$
D
$\frac{a + f}{2(b - 1)}$
Solution
(B) The position of car $P$ at any time $t$ is given by $x_P(t) = at + bt^2$.
The velocity of car $P$ is $v_P(t) = \frac{dx_P(t)}{dt} = a + 2bt$ ... $(i)$.
Similarly,for car $Q$,the position is $x_Q(t) = ft - t^2$.
The velocity of car $Q$ is $v_Q(t) = \frac{dx_Q(t)}{dt} = f - 2t$ ... $(ii)$.
Given that the cars have the same velocity,$v_P(t) = v_Q(t)$.
Therefore,$a + 2bt = f - 2t$.
Rearranging the terms to solve for $t$: $2bt + 2t = f - a$.
$2t(b + 1) = f - a$.
Thus,$t = \frac{f - a}{2(1 + b)}$.
0 likes
View SolutionMotion in Straight Line — Instantaneous Velocity and Speed and Velocity-time Graph · Frequently Asked Questions
1Are these Motion in Straight Line questions useful for JEE and NEET?
Yes. All questions in this section are mapped to JEE Main and NEET exam patterns. Previous year questions from JEE Main, NEET, GUJCET and state-level exams are included with full solutions.
2Can I switch to Hindi or Gujarati for these questions?
Yes. Use the language tabs in the hero section or the sidebar to view the same questions and solutions in English, Hindi or Gujarati.
3How do I generate a question paper from this subtopic?
Use the Vedclass Exam Paper Generator — select the chapter and subtopic, set difficulty, and generate Sets A, B, C, D automatically. First 3 chapters of every subject are free.
Vedclass Products
For Students
Vedclass Test Series
Mock tests in real JEE/NEET style with performance analysis. 5-day free trial.
Start Free TrialFor Teachers
Exam Paper Generator
Generate Set A/B/C/D papers from this chapter in 2 minutes. 3 chapters free.
Try FreeFor Institutes
Online Exam Module
Live online exams with unlimited students, 360° analytics & white-label branding.
See DemoFor Teachers & Institutes
Generate a Motion in Straight Line Exam Paper in 2 Minutes
Select subtopic & difficulty — Sets A, B, C, D auto-generated with No Repeat logic.
First 3 chapters of every subject are free — no payment required.