
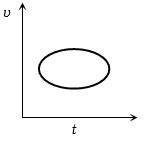
Which of the following velocity-time graphs shows a realistic situation for a body in motion?
- A
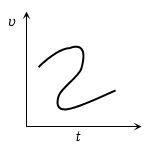
- B
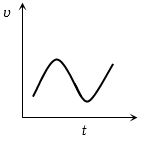
- C
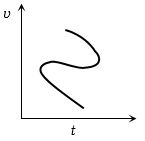
- D
Explore More
Similar Questions
The graph between the displacement $x$ and time $t$ for a particle moving in a straight line is shown in the figure. Determine the sign of the acceleration of the particle for the intervals $OA$,$AB$,$BC$,and $CD$ respectively.
Medium
View SolutionIf a steel ball is dropped from a height onto a marble floor,what will the velocity-time graph look like?
Medium
View SolutionThe velocity $(v)$ versus time $(t)$ plot of a particle is shown in the figure,for a time interval of $40 \text{ s}$. The total distance travelled by the particle and the average velocity during this period are,respectively . . . . . . .
What does a vehicle's speedometer measure: instantaneous velocity or instantaneous speed?
Medium
View SolutionThe position $x$ of a particle moving in one dimension under the influence of a constant force is given by $t = \sqrt{x} + 3$,where $x$ is in meters and $t$ is in seconds. Find the displacement of the particle in $m$ when its velocity becomes zero.
Difficult
View SolutionVedclass Products
For Students
Vedclass Test Series
Mock tests in real JEE/NEET style with performance analysis. 5-day free trial.
Start Free TrialFor Teachers
Exam Paper Generator
Generate Set A/B/C/D exam papers from 7.5L+ questions in 2 minutes. 3 chapters free.
Try FreeFor Institutes
Online Exam Module
Live online exams with unlimited students, 360° analytics & white-label branding.
See Demo