
Difficult
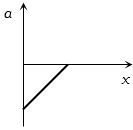
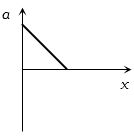
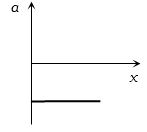
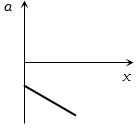
The given graph shows the variation of velocity $v$ with displacement $x$. Which one of the graphs given below correctly represents the variation of acceleration $a$ with displacement $x$?
- A
- B
- C
- D
Explore More
Similar Questions
The motion of an airplane is represented by a velocity-time graph as shown below. The distance covered by the airplane in the first $30.5 \ s$ is . . . . . . $km$.
Find the acceleration of the particle at $x = 5\,m$ using the given $v^2-x$ graph,where $v$ is velocity and $x$ is displacement.
Medium
View Solution$Assertion$ : Velocity-time graph for an object in uniform motion along a straight path is a straight line parallel to the time axis.
$Reason$ : In uniform motion of an object velocity increases as the square of time elapsed.
$Reason$ : In uniform motion of an object velocity increases as the square of time elapsed.
What does a vehicle's speedometer measure: instantaneous velocity or instantaneous speed?
Medium
View SolutionThe displacement of a particle as a function of time is shown in the figure. It indicates:
Medium
View SolutionVedclass Products
For Students
Vedclass Test Series
Mock tests in real JEE/NEET style with performance analysis. 5-day free trial.
Start Free TrialFor Teachers
Exam Paper Generator
Generate Set A/B/C/D exam papers from 7.5L+ questions in 2 minutes. 3 chapters free.
Try FreeFor Institutes
Online Exam Module
Live online exams with unlimited students, 360° analytics & white-label branding.
See Demo