
Difficult
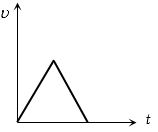
The acceleration-time graph of a body is shown below. The most probable velocity-time graph of the body is:
- A
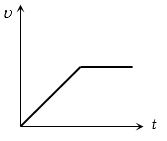
- B
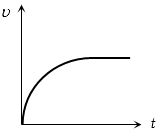
- C
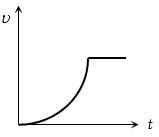
- D
Explore More
Similar Questions
The position of a particle related to time is given by $x = (5t^2 - 4t + 5) \, m$. The magnitude of velocity of the particle at $t = 2 \, s$ will be $........... \, ms^{-1}$.
If a steel ball is dropped from a height onto a marble floor,what will the velocity-time graph look like?
Medium
View SolutionWhich of the following velocity-time graphs represents uniform motion?
Easy
View SolutionIn the following velocity-time graph,the distance travelled by the body in metres is ............. $m$.
Easy
View SolutionExplain instantaneous velocity.
Easy
View SolutionVedclass Products
For Students
Vedclass Test Series
Mock tests in real JEE/NEET style with performance analysis. 5-day free trial.
Start Free TrialFor Teachers
Exam Paper Generator
Generate Set A/B/C/D exam papers from 7.5L+ questions in 2 minutes. 3 chapters free.
Try FreeFor Institutes
Online Exam Module
Live online exams with unlimited students, 360° analytics & white-label branding.
See Demo