
Medium
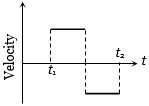
$A$ batsman hits a sixer and the ball touches the ground outside the cricket ground. Which of the following graphs describes the variation of the cricket ball's vertical velocity $v$ with time between the time $t_1$ as it hits the bat and time $t_2$ when it touches the ground?
- A
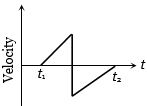
- B
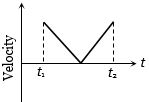
- C
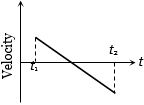
- D
Explore More
Similar Questions
The acceleration versus velocity graph of a particle moving in a straight line starting from rest is as shown in the figure. The corresponding velocity-time graph would be:
Difficult
View SolutionWe have carefully distinguished between average speed and magnitude of average velocity. No such distinction is necessary when we consider instantaneous speed and magnitude of velocity. The instantaneous speed is always equal to the magnitude of instantaneous velocity. Why?
Easy
View SolutionThe position of a particle moving along the $y-$ axis is given as $y = 3t^2 - t^3$,where $y$ is in $m$ and $t$ is in $s$. The time when the particle attains the maximum positive position will be ........ $s$.
Medium
View SolutionIs the statement 'The slope of a position-time graph can be negative' true or false?
Easy
View SolutionIf $t = \sqrt{x} + 4$,then $\left(\frac{dx}{dt}\right)_{t=4}$ is:
Vedclass Products
For Students
Vedclass Test Series
Mock tests in real JEE/NEET style with performance analysis. 5-day free trial.
Start Free TrialFor Teachers
Exam Paper Generator
Generate Set A/B/C/D exam papers from 7.5L+ questions in 2 minutes. 3 chapters free.
Try FreeFor Institutes
Online Exam Module
Live online exams with unlimited students, 360° analytics & white-label branding.
See Demo