
Difficult
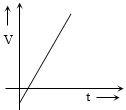
For the given displacement-time graph,what will the corresponding velocity-time graph look like?
- A
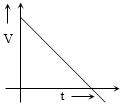
- B
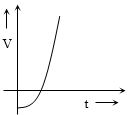
- C
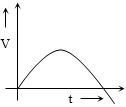
- D
Explore More
Similar Questions
The velocity-time graph of a body moving in a straight line is shown in the figure. The displacement and distance travelled by the body in $6 \, s$ are respectively:
Medium
View SolutionMatch Column-$I$ with Column-$II$ based on the distance-time $(d-t)$ graphs provided in the image.
$(1)$ Velocity decreases $(a)$ Linear graph (constant slope) $(2)$ Velocity increases $(b)$ Concave up graph (increasing slope) $(3)$ Velocity is constant $(c)$ Concave down graph (decreasing slope)
| $(1)$ Velocity decreases | $(a)$ Linear graph (constant slope) |
| $(2)$ Velocity increases | $(b)$ Concave up graph (increasing slope) |
| $(3)$ Velocity is constant | $(c)$ Concave down graph (decreasing slope) |
Easy
View SolutionThe velocity-time $(v-t)$ graph for a moving object is shown in the figure. The total displacement of the object during the time interval when there is non-zero acceleration and retardation is ........ $m$.
Medium
View Solution$A$ particle is moving along the $Y$-axis. The position of the particle from the origin as a function of time $(t)$ is given as $y(t) = 10 t e^{-2 t}$. How far is the particle from the origin when it stops momentarily? ($y$ is given in units of metre and $t$ is in units of second)
The graph of displacement $s$ versus time $t$ is given below. Its corresponding velocity-time graph will be:
Medium
View SolutionVedclass Products
For Students
Vedclass Test Series
Mock tests in real JEE/NEET style with performance analysis. 5-day free trial.
Start Free TrialFor Teachers
Exam Paper Generator
Generate Set A/B/C/D exam papers from 7.5L+ questions in 2 minutes. 3 chapters free.
Try FreeFor Institutes
Online Exam Module
Live online exams with unlimited students, 360° analytics & white-label branding.
See Demo