
A English
Instantaneous Velocity and Speed and Velocity-time Graph Questions in English
Class 11 Physics · Motion in Straight Line · Instantaneous Velocity and Speed and Velocity-time Graph
244+
Questions
English
Language
100%
With Solutions
Showing 50 of 244 questions in English
101
DifficultMCQ
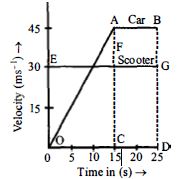
The velocity-time graphs of a car and a scooter are shown in the figure. $(i)$ The difference between the distance travelled by the car and the scooter in $15\, s$ and $(ii)$ the time at which the car will catch up with the scooter are,respectively:
A
$337.5\,m$ and $25\,s$
B
$225.5\,m$ and $10\,s$
C
$112.5\,m$ and $22.5\,s$
D
$112.5\,m$ and $15\,s$
Solution
(C) From the graph:
For the car,the velocity increases uniformly from $0$ to $45\,m/s$ in $15\,s$. The distance travelled by the car in $15\,s$ is the area under the triangle $OAC$,which is $\frac{1}{2} \times \text{base} \times \text{height} = \frac{1}{2} \times 15\,s \times 45\,m/s = 337.5\,m$.
For the scooter,the velocity is constant at $30\,m/s$. The distance travelled by the scooter in $15\,s$ is $30\,m/s \times 15\,s = 450\,m$.
$(i)$ The difference in distance travelled in $15\,s$ is $450\,m - 337.5\,m = 112.5\,m$.
$(ii)$ After $15\,s$,the car moves with a constant velocity of $45\,m/s$. Let the car catch up with the scooter at time $t$ (where $t > 15\,s$).
Distance of scooter at time $t = 30t$.
Distance of car at time $t = 337.5 + 45(t - 15)$.
Equating the distances: $30t = 337.5 + 45t - 675$.
$15t = 337.5 \Rightarrow t = 22.5\,s$.
0 likes
View Solution102
DifficultMCQ
Which graph corresponds to an object moving with a constant negative acceleration and a positive velocity?
A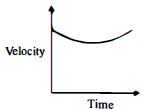
B
C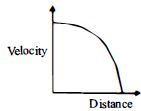
D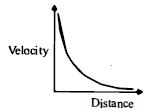
Solution
(C) Given that the object is moving with a constant negative acceleration,we have $a = -C$,where $C$ is a positive constant.
Using the kinematic relation $a = v \frac{dv}{dx}$,we get:
$v \frac{dv}{dx} = -C$
$v \, dv = -C \, dx$
Integrating both sides,we get:
$\int v \, dv = \int -C \, dx$
$\frac{v^2}{2} = -Cx + k$
$v^2 = -2Cx + 2k$
This equation represents a parabola of the form $v^2 = -Ax + B$,which corresponds to a velocity-distance graph that is concave downward,starting from a positive velocity and decreasing to zero as distance increases. This matches the graph in option $C$.
0 likes
View Solution103
MediumMCQ
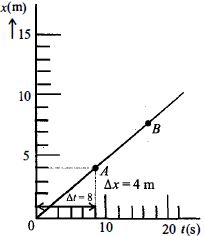
The graph of an object's motion (along the $x-$ axis) is shown in the figure. The instantaneous velocity of the object at points $A$ and $B$ are $v_A$ and $v_B$ respectively. Then
A
$v_A = v_B = 0.5\,m/s$
B
$v_A = 0.5\,m/s < v_B$
C
$v_A = 0.5\,m/s > v_B$
D
$v_A = v_B = 2\,m/s$
Solution
(A) The instantaneous velocity $v$ is given by the slope of the position-time graph,$v = \frac{dx}{dt}$.
Since the graph is a straight line,the slope is constant at all points.
From the graph,at point $A$,the displacement $\Delta x = 4\,m$ occurs in time $\Delta t = 8\,s$.
Therefore,$v_A = \frac{4\,m}{8\,s} = 0.5\,m/s$.
Similarly,at point $B$,the slope of the line remains the same.
Thus,$v_B = 0.5\,m/s$.
Therefore,$v_A = v_B = 0.5\,m/s$.
0 likes
View Solution104
EasyMCQ
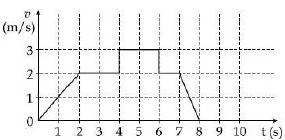
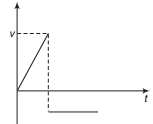
$A$ particle starts from the origin at time $t = 0$ and moves along the positive $x-$ axis. The velocity-time graph is shown in the figure. What is the position of the particle at time $t = 5\,s$ (in $,m$)?
A
$10$
B
$6$
C
$3$
D
$9$
Solution
(D) The position of the particle at any time $t$ is given by the area under the velocity-time graph from $t = 0$ to $t = 5\,s$.
$1$. From $t = 0$ to $t = 2\,s$,the graph is a triangle with base $2\,s$ and height $2\,m/s$. Area = $\frac{1}{2} \times 2 \times 2 = 2\,m$.
$2$. From $t = 2\,s$ to $t = 4\,s$,the graph is a rectangle with width $2\,s$ and height $2\,m/s$. Area = $2 \times 2 = 4\,m$.
$3$. From $t = 4\,s$ to $t = 5\,s$,the graph is a rectangle with width $1\,s$ and height $3\,m/s$. Area = $1 \times 3 = 3\,m$.
Total position at $t = 5\,s$ = $2 + 4 + 3 = 9\,m$.
0 likes
View Solution105
MediumMCQ
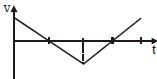
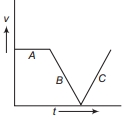
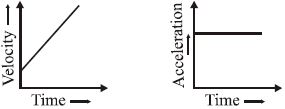
The graph below shows the velocity versus time graph for a body. Which of the following graphs represents the corresponding acceleration $v/s$ time graph?
A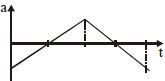
B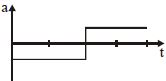
C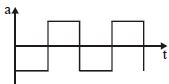
D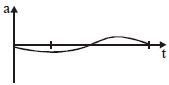
Solution
(A) The acceleration $a$ of a body is given by the slope of the velocity-time $(v-t)$ graph,i.e.,$a = \frac{dv}{dt}$.
In the given $v-t$ graph,the velocity decreases linearly with time initially,which means the slope is constant and negative. Thus,the acceleration is constant and negative.
After reaching a minimum velocity,the velocity increases linearly with time,which means the slope is constant and positive. Thus,the acceleration is constant and positive.
Comparing this with the given options,the graph that represents a constant negative acceleration followed by a constant positive acceleration is option $A$.
0 likes
View Solution106
EasyMCQ
Which of the following curves does not represent motion in one dimension?
A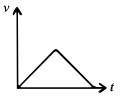
B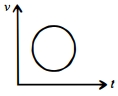
C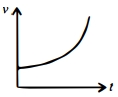
D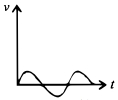
Solution
(B) In a velocity-time $(v-t)$ graph,for a given instant of time $t$,there should be only one unique value of velocity $v$.
If we draw a vertical line at any time $t$ on the graph,it should intersect the curve at only one point.
In option $(B)$,the curve is a circle. $A$ vertical line drawn at any time $t$ (within the range of the circle) will intersect the circle at two points,meaning the particle has two different velocities at the same instant of time,which is physically impossible for motion in one dimension.
Therefore,the circular graph does not represent motion in one dimension.
0 likes
View Solution107
DifficultMCQ
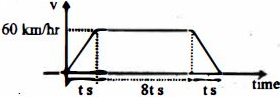
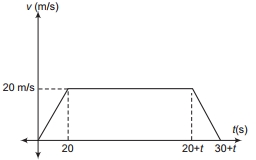
Between two stations,a train accelerates uniformly at first,then moves with constant velocity,and finally retards uniformly. If the ratio of the time taken is $1 : 8 : 1$ and the maximum speed attained is $60\,km/h,$ what is the average speed over the whole journey in $km/h$?
A
$48$
B
$52$
C
$54$
D
$56$
Solution
(C) The average speed is defined as the total distance traveled divided by the total time taken.
Total distance = Area under the $v-t$ graph.
The $v-t$ graph is a trapezium with parallel sides of length $8t$ and $(t + 8t + t) = 10t$,and height $v_{max} = 60\,km/h$.
Total distance = $\frac{1}{2} \times (8t + 10t) \times 60 = \frac{1}{2} \times 18t \times 60 = 540t$.
Total time = $t + 8t + t = 10t$.
Average speed = $\frac{\text{Total distance}}{\text{Total time}} = \frac{540t}{10t} = 54\,km/h$.
0 likes
View Solution108
MediumMCQ
The velocity-time graph of a body is shown in the figure. It implies that at point $B$
A
the force is zero
B
there is a force towards motion
C
there is a force which opposes motion
D
there is only gravitational force
Solution
(C) In the velocity-time graph,the slope represents acceleration $(a = dv/dt)$.
At point $B$,the slope of the graph is negative,which means the acceleration is negative (deceleration).
According to Newton's second law of motion,$F = ma$. Since the acceleration is negative,the net force acting on the body must also be negative.
$A$ negative force acting on a body moving in a positive direction indicates that the force is opposing the motion of the body.
Therefore,at point $B$,there is a force that opposes the motion.
0 likes
View Solution109
MediumMCQ
The velocity-time graph for a particle moving along the $x$-axis is shown in the figure. The corresponding displacement-time graph is correctly shown by
A
B
C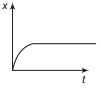
D
Solution
(D) The velocity-time $(v-t)$ graph shows that the velocity increases linearly from $0$ to a maximum value $v$ in the first interval,indicating constant positive acceleration.
For a constant positive acceleration,the displacement-time $(x-t)$ graph must be a parabola opening upwards $(x \propto t^2)$.
In the second interval,the velocity is constant and negative,which means the particle moves with a constant negative velocity.
For constant negative velocity,the $x-t$ graph must be a straight line with a negative slope.
Comparing this with the given options,the graph that shows a parabolic increase followed by a straight-line decrease is represented by option $D$.
0 likes
View Solution110
EasyMCQ
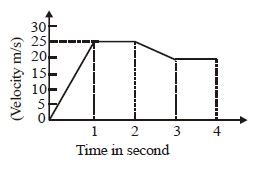
The variation of velocity of a particle moving along a straight line with time is illustrated in the following figure. The distance travelled by the particle in $4 \, s$ is: (in $, m$)
A
$60$
B
$55$
C
$25$
D
$80$
Solution
(D) The distance travelled by a particle is equal to the area under the velocity-time $(v-t)$ graph.
$1$. For the interval $t = 0$ to $t = 1 \, s$: The area is a triangle with base $= 1 \, s$ and height $= 25 \, m/s$.
Area$_1 = \frac{1}{2} \times 1 \times 25 = 12.5 \, m$.
$2$. For the interval $t = 1$ to $t = 2 \, s$: The area is a rectangle with width $= 1 \, s$ and height $= 25 \, m/s$.
Area$_2 = 1 \times 25 = 25 \, m$.
$3$. For the interval $t = 2$ to $t = 3 \, s$: The area is a trapezoid with parallel sides $25 \, m/s$ and $20 \, m/s$ and height $= 1 \, s$.
Area$_3 = \frac{1}{2} \times (25 + 20) \times 1 = 22.5 \, m$.
$4$. For the interval $t = 3$ to $t = 4 \, s$: The area is a rectangle with width $= 1 \, s$ and height $= 20 \, m/s$.
Area$_4 = 1 \times 20 = 20 \, m$.
Total distance $= 12.5 + 25 + 22.5 + 20 = 80 \, m$.
0 likes
View Solution111
MediumMCQ
The area $A$ of a blot of ink is growing such that after $t$ seconds its area is given by $A = (3t^2 + 7) \, cm^2$. Calculate the rate of increase of area at $t = 2 \, s$. .......... $cm^2/s$
A
$6$
B
$17$
C
$12$
D
$19$
Solution
(C) The area of the ink blot is given by the function $A(t) = 3t^2 + 7$.
To find the rate of increase of the area,we need to calculate the derivative of $A$ with respect to time $t$,which is $\frac{dA}{dt}$.
Using the power rule for differentiation,$\frac{d}{dt}(3t^2 + 7) = 3(2t) + 0 = 6t$.
Now,we evaluate this rate at $t = 2 \, s$:
$\frac{dA}{dt} \Big|_{t=2} = 6(2) = 12 \, cm^2/s$.
Thus,the rate of increase of the area at $t = 2 \, s$ is $12 \, cm^2/s$.
0 likes
View Solution112
MediumMCQ
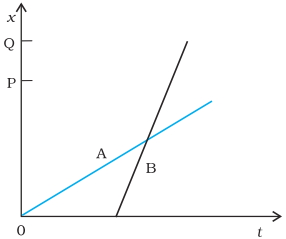
The figure shows the position-time $(x-t)$ graph of the motion of two boys $A$ and $B$ returning from school $O$ to their homes $P$ and $Q$ respectively. Which of the following statements is true?

A
$A$ walks faster than $B$
B
Both $A$ and $B$ reach home at the same time
C
$B$ starts for home earlier than $A$
D
$B$ overtakes $A$ on his way to home
Solution
(D) The correct answer is $(d)$.
$1$. The slope of a position-time $(x-t)$ graph represents the velocity (or speed) of the object. $A$ steeper slope indicates a higher speed.
$2$. From the graph,the line representing boy $B$ is steeper than the line representing boy $A$,which means $B$ walks faster than $A$.
$3$. The graph shows that the lines for $A$ and $B$ intersect at a point. This intersection point indicates that at that specific time,both boys are at the same position. Since $B$ starts later but reaches the same position as $A$ and continues to move,it implies that $B$ overtakes $A$ on his way to home.
$4$. Therefore,statement $(d)$ is true.
0 likes
View Solution113
EasyMCQ
The $x-t$ equation is given as $x = 2t + 1$. The corresponding $v-t$ graph is:
A
a straight line passing through origin
B
a straight line not passing through origin
C
a parabola
D
None of the above
Solution
(B) Given the position-time equation: $x = 2t + 1$.
To find the velocity $v$,we differentiate $x$ with respect to time $t$:
$v = \frac{dx}{dt} = \frac{d}{dt}(2t + 1) = 2 \, m/s$.
Since the velocity $v = 2 \, m/s$ is a constant value independent of time $t$,the $v-t$ graph will be a horizontal straight line parallel to the time axis.
$A$ horizontal line at $v = 2$ does not pass through the origin $(0,0)$.
Therefore,the correct option is $B$.
0 likes
View Solution114
EasyMCQ
The position $x$ of a particle varies with time $t$ as $x = ct^2 + b$,where $c$ and $b$ are positive constants. Which of the following graphs is correct?
A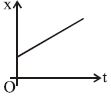
B
C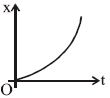
D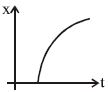
Solution
(B) The given equation is $x = ct^2 + b$. This is the equation of a parabola.
At $t = 0$,$x = b$. Since $b$ is a positive constant,the graph must intersect the $x$-axis at a positive value $b$ (i.e.,the $y$-intercept is positive).
As $t$ increases,$x$ increases quadratically with $t$. The slope of the $x-t$ graph is given by $v = \frac{dx}{dt} = 2ct$. Since $c > 0$,the velocity $v$ is positive and increases linearly with time,meaning the graph is concave upwards.
Therefore,the graph is a parabola that opens upwards and has a positive $y$-intercept at $x = b$.
0 likes
View Solution115
MediumMCQ
The position of a particle moving along the $y-$ axis is given as $y = 3t^2 - t^3$,where $y$ is in $m$ and $t$ is in $s$. The time when the particle attains the maximum positive position will be ........ $s$.
A
$1.5$
B
$4$
C
$2$
D
$3$
Solution
(C) The position of the particle is given by the function $y(t) = 3t^2 - t^3$.
To find the time at which the particle attains the maximum positive position,we calculate the first derivative of $y$ with respect to $t$ and set it to zero:
$\frac{dy}{dt} = 6t - 3t^2$.
Setting $\frac{dy}{dt} = 0$ gives $3t(2 - t) = 0$,which results in $t = 0$ or $t = 2$.
To confirm the maximum,we find the second derivative: $\frac{d^2y}{dt^2} = 6 - 6t$.
At $t = 2$,$\frac{d^2y}{dt^2} = 6 - 6(2) = -6$. Since the second derivative is negative,the function attains a local maximum at $t = 2 \ s$.
0 likes
View Solution116
MediumMCQ
The velocity-time and acceleration-time graphs of a particle are given. Its position-time graph may be given as:
A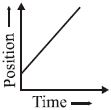
B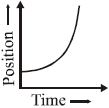
C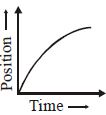
D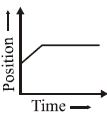
Solution
(B) From the given velocity-time graph,we observe that the velocity $v$ increases linearly with time $t$. This implies that the acceleration $a = \frac{dv}{dt}$ is constant and positive,which is consistent with the provided acceleration-time graph.
Since $v = \frac{dx}{dt}$,and $v$ is a linear function of time (i.e.,$v = at + u$),the position $x$ is given by the integral of velocity with respect to time:
$x = \int v \, dt = \int (at + u) \, dt = \frac{1}{2}at^2 + ut + x_0$
This equation represents a parabola. Since the acceleration $a$ is positive,the position-time graph must be a parabola that opens upwards (concave up).
Therefore,the correct graph is the one showing a parabolic increase in position with time.
0 likes
View Solution117
DifficultMCQ
The displacement $x$ of a particle in a straight line motion is given by $x = 1 - t - t^2$. The correct representation of the motion is $..............$.
A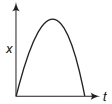
B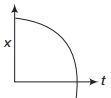
C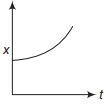
D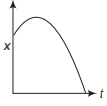
Solution
(D) The displacement of the particle is given by the equation $x = 1 - t - t^2$.
To find the velocity $v$,we differentiate the displacement with respect to time $t$:
$v = \frac{dx}{dt} = \frac{d}{dt}(1 - t - t^2) = -1 - 2t$.
To find the acceleration $a$,we differentiate the velocity with respect to time $t$:
$a = \frac{dv}{dt} = \frac{d}{dt}(-1 - 2t) = -2 \, m/s^2$.
Since the acceleration $a = -2 \, m/s^2$ is constant and negative,the $x-t$ graph must be a downward-opening parabola.
At $t = 0$,$x = 1 - 0 - 0^2 = 1 \, m$. Thus,the graph starts at $x = 1$ on the vertical axis.
At $t = 0$,the velocity $v = -1 - 2(0) = -1 \, m/s$. Since the velocity is negative,the slope of the graph at $t = 0$ must be negative.
Among the given options,the graph that starts at $x = 1$ with a negative slope and curves downwards (representing constant negative acceleration) is Graph $D$.
0 likes
View Solution118
MediumMCQ
The velocity $v$ of a particle is given by the equation $v = 6t^2 - 6t^3$,where $v$ is in $m/s$ and $t$ is time in $s$. Then:
A
at $t = 0$,velocity is maximum
B
at $t = 2/3 \ s$,velocity is minimum
C
minimum velocity is zero
D
minimum velocity is $-2 \ m/s$
Solution
(C) Given the velocity equation: $v(t) = 6t^2 - 6t^3$.
To find the extrema,we calculate the first derivative with respect to time: $\frac{dv}{dt} = 12t - 18t^2$.
Setting $\frac{dv}{dt} = 0$,we get $6t(2 - 3t) = 0$,which gives critical points at $t = 0 \ s$ and $t = 2/3 \ s$.
Now,we find the second derivative: $\frac{d^2v}{dt^2} = 12 - 36t$.
Evaluating at $t = 0$: $\frac{d^2v}{dt^2} = 12 - 36(0) = 12 > 0$. Since the second derivative is positive,$t = 0 \ s$ corresponds to a local minimum.
Evaluating at $t = 2/3$: $\frac{d^2v}{dt^2} = 12 - 36(2/3) = 12 - 24 = -12 < 0$. Since the second derivative is negative,$t = 2/3 \ s$ corresponds to a local maximum.
At $t = 0 \ s$,the velocity $v = 6(0)^2 - 6(0)^3 = 0 \ m/s$. Thus,the minimum velocity is $0 \ m/s$.
0 likes
View Solution119
MediumMCQ
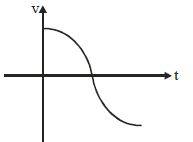
The graph shows the variation with time $t$ of velocity $v$ of an object moving along a straight line. The $a-t$ graph will be:
A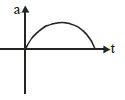
B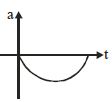
C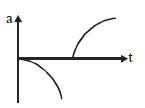
D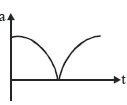
Solution
(C) The acceleration $a$ is defined as the rate of change of velocity with respect to time,given by $a = \frac{dv}{dt}$. This represents the slope of the $v-t$ graph.
$1$. At the beginning $(t=0)$,the slope of the $v-t$ graph is zero,so $a=0$.
$2$. As $t$ increases,the slope becomes negative and its magnitude increases,reaching a maximum negative value at the point of inflection (where the curve changes from concave down to concave up).
$3$. At the point where the velocity $v$ crosses the $t$-axis,the slope is at its maximum negative value.
$4$. As $t$ continues to increase,the slope remains negative but its magnitude decreases,approaching zero as the curve flattens out.
Looking at the options,the graph that starts at $a=0$,becomes negative,reaches a minimum,and returns towards $0$ is represented by option $C$.
0 likes
View Solution120
DifficultMCQ
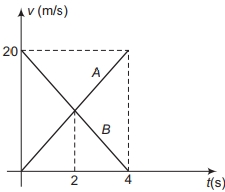
The speed-time graph of two cars $A$ and $B$ approaching each other is shown in the figure. The initial distance between them is $60\,m$. The two cars will cross each other after time $..........\,s$.
A
$2$
B
$3$
C
$1.5$
D
$\sqrt{2}$
Solution
(B) The slope of the $v-t$ graph gives the acceleration or retardation. For both cars,the magnitude of acceleration is $|a| = \frac{20\,m/s}{4\,s} = 5\,m/s^2$.
Car $A$ starts from rest and accelerates,so its displacement at time $t$ is $s_A = \frac{1}{2} \times 5 \times t^2$.
Car $B$ starts with an initial velocity of $20\,m/s$ and undergoes retardation,so its displacement at time $t$ is $s_B = 20t - \frac{1}{2} \times 5 \times t^2$.
The cars will cross each other when the sum of their displacements equals the initial distance between them:
$s_A + s_B = 60$
$\frac{1}{2} \times 5 \times t^2 + (20t - \frac{1}{2} \times 5 \times t^2) = 60$
$20t = 60$
$t = 3\,s$.
0 likes
View Solution121
MediumMCQ
$A$ small electric car has a maximum constant acceleration of $1\,m/s^2$,a maximum constant deceleration of $2\,m/s^2$,and a maximum speed of $20\,m/s$. The amount of time it would take to drive this car $1\,km$ starting from rest and finishing at rest is $.........\,s$.
A
$15$
B
$50$
C
$35$
D
$65$
Solution
(D) The car accelerates from rest to a maximum speed of $20\,m/s$ at $a = 1\,m/s^2$. The time taken for acceleration is $t_1 = v/a = 20/1 = 20\,s$. The distance covered during this phase is $d_1 = (1/2) \times a \times t_1^2 = (1/2) \times 1 \times 20^2 = 200\,m$.
The car decelerates from $20\,m/s$ to rest at $a' = 2\,m/s^2$. The time taken for deceleration is $t_3 = v/a' = 20/2 = 10\,s$. The distance covered during this phase is $d_3 = (1/2) \times a' \times t_3^2 = (1/2) \times 2 \times 10^2 = 100\,m$.
The total distance is $1\,km = 1000\,m$. The distance covered at constant speed is $d_2 = 1000 - (200 + 100) = 700\,m$. The time taken at constant speed is $t_2 = d_2 / v = 700 / 20 = 35\,s$.
The total time taken is $T = t_1 + t_2 + t_3 = 20 + 35 + 10 = 65\,s$.
0 likes
View Solution122
MediumMCQ
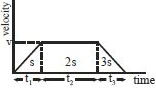
$A$ body starts from rest and travels a distance $S$ with uniform acceleration,then moves uniformly a distance $2S$ and finally comes to rest after moving further $3S$ under uniform retardation. The ratio of the average velocity to maximum velocity is
A
$0.4$
B
$0.6$
C
$0.57$
D
$0.71$
Solution
(B) The motion is represented by a velocity-time graph. The area under the velocity-time graph gives the total distance traveled.
Let $v$ be the maximum velocity reached.
For the first part (acceleration): Distance $S = \frac{1}{2} \times t_1 \times v \Rightarrow t_1 = \frac{2S}{v}$.
For the second part (uniform motion): Distance $2S = v \times t_2 \Rightarrow t_2 = \frac{2S}{v}$.
For the third part (retardation): Distance $3S = \frac{1}{2} \times t_3 \times v \Rightarrow t_3 = \frac{6S}{v}$.
Total distance $D = S + 2S + 3S = 6S$.
Total time $T = t_1 + t_2 + t_3 = \frac{2S}{v} + \frac{2S}{v} + \frac{6S}{v} = \frac{10S}{v}$.
Average velocity $v_{avg} = \frac{\text{Total distance}}{\text{Total time}} = \frac{6S}{10S/v} = 0.6v$.
Therefore,the ratio $\frac{v_{avg}}{v} = 0.6$.
0 likes
View Solution123
MediumMCQ
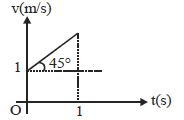
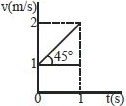
From the $v-t$ graph,the
A
speed at $t = 1\,s$ is $1.2\, m/s$
B
acceleration is $2\, m/s^2$
C
average speed during $1^{st}\, second$ is $1.5\, m/s$
D
speed of the particle can be zero
Solution
(C) From the graph,the initial velocity $u = 1\, m/s$ at $t = 0\, s$ and final velocity $v = 2\, m/s$ at $t = 1\, s$.
The acceleration $a$ is the slope of the $v-t$ graph:
$a = \tan(45^{\circ}) = 1\, m/s^2$.
The distance covered is the area under the $v-t$ graph,which is a trapezoid:
$s = \text{Area} = \frac{1}{2} \times (u + v) \times t = \frac{1}{2} \times (1 + 2) \times 1 = 1.5\, m$.
The average speed is given by:
$v_{avg} = \frac{\text{Total distance}}{\text{Total time}} = \frac{1.5\, m}{1\, s} = 1.5\, m/s$.
Thus,option $C$ is correct.
0 likes
View Solution124
DifficultMCQ
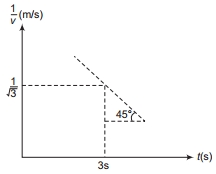
The diagram shows the variation of $1/v$ (where $v$ is the velocity of the particle) with respect to time $t$. Using the details given in the graph,the instantaneous acceleration at time $t = 3\,s$ will be equal to $...........\,m/s^2$.
A
$-2$
B
$+3$
C
$+5$
D
$-6$
Solution
(B) From the graph,the equation of the straight line is given by the slope-intercept form: $\frac{1}{v} = mt + c$.
The slope $m = \tan(180^\circ - 45^\circ) = -\tan(45^\circ) = -1$.
At $t = 3\,s$,$\frac{1}{v} = \frac{1}{\sqrt{3}}$.
Using the equation $\frac{1}{v} = -t + c$,we substitute the values at $t = 3\,s$:
$\frac{1}{\sqrt{3}} = -3 + c \implies c = 3 + \frac{1}{\sqrt{3}}$.
Thus,the equation is $\frac{1}{v} = -t + (3 + \frac{1}{\sqrt{3}})$.
Rearranging for $v$: $v = \frac{1}{(3 + \frac{1}{\sqrt{3}}) - t}$.
The acceleration $a$ is given by $a = \frac{dv}{dt}$.
Using the chain rule: $a = \frac{d}{dt} [(3 + \frac{1}{\sqrt{3}}) - t]^{-1} = -1 \cdot [-1] \cdot [(3 + \frac{1}{\sqrt{3}}) - t]^{-2} = \frac{1}{[(3 + \frac{1}{\sqrt{3}}) - t]^2}$.
At $t = 3\,s$,the term $[(3 + \frac{1}{\sqrt{3}}) - t] = \frac{1}{\sqrt{3}}$.
Therefore,$a = \frac{1}{(1/\sqrt{3})^2} = \frac{1}{1/3} = 3\,m/s^2$.
0 likes
View Solution125
MediumMCQ
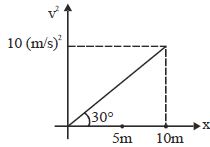
Find the acceleration of the particle at $x = 5\,m$ using the given $v^2-x$ graph,where $v$ is velocity and $x$ is displacement.
A
$\frac{1}{\sqrt{3}}\,m/s^2$
B
$\frac{1}{\sqrt{2}}\,m/s^2$
C
$\frac{2}{\sqrt{3}}\,m/s^2$
D
$\frac{1}{2\sqrt{3}}\,m/s^2$
Solution
(D) The equation of motion is $v^2 = u^2 + 2ax$. From the graph,$v^2$ is plotted against $x$,which represents a straight line passing through the origin with a slope $m = \frac{dv^2}{dx} = 2a$.
From the graph,the slope $m = \tan(30^\circ) = \frac{1}{\sqrt{3}}$.
Therefore,$2a = \frac{1}{\sqrt{3}}$.
Thus,the acceleration $a = \frac{1}{2\sqrt{3}}\,m/s^2$. Since the slope is constant,the acceleration is constant for all values of $x$.
From the graph,the slope $m = \tan(30^\circ) = \frac{1}{\sqrt{3}}$.
Therefore,$2a = \frac{1}{\sqrt{3}}$.
Thus,the acceleration $a = \frac{1}{2\sqrt{3}}\,m/s^2$. Since the slope is constant,the acceleration is constant for all values of $x$.
0 likes
View Solution126
DifficultMCQ
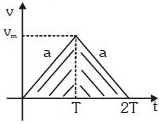
$A$ car starts from rest and moves with uniform acceleration $a$ on a straight road from time $t = 0$ to $t = T$. After that,a constant deceleration $a$ brings it to rest. In this process,the average speed of the car is
A
$\frac{aT}{4}$
B
$\frac{3aT}{2}$
C
$\frac{aT}{2}$
D
$aT$
Solution
(C) The motion can be represented by a velocity-time graph which is a triangle with base $2T$ and height $v_m$.
For the first part ($t=0$ to $t=T$),the car starts from rest with acceleration $a$. The maximum velocity reached is $v_m = aT$.
The total distance $s$ traveled is equal to the area under the velocity-time graph.
$s = \text{Area of triangle} = \frac{1}{2} \times \text{base} \times \text{height} = \frac{1}{2} \times (2T) \times v_m = T \times v_m$.
Substituting $v_m = aT$,we get $s = T(aT) = aT^2$.
The total time taken is $t_{total} = 2T$.
The average speed is given by $v_{avg} = \frac{\text{total distance}}{\text{total time}} = \frac{aT^2}{2T} = \frac{aT}{2}$.
0 likes
View Solution127
DifficultMCQ
Among the four graphs shown in the figure,there is only one graph for which the average velocity over the time interval $(0, T)$ can vanish for a suitably chosen $T$. Which one is it?
A
B
C
D
Solution
(B) The average velocity over a time interval $(0, T)$ is defined as the total displacement divided by the total time: $v_{avg} = \frac{x(T) - x(0)}{T}$.
For the average velocity to vanish (i.e.,$v_{avg} = 0$),the displacement must be zero,which means $x(T) = x(0)$.
This implies that the position of the particle at time $T$ must be the same as its position at time $t = 0$.
Looking at the given graphs:
In graph $B$,the curve starts at a certain position $x(0)$ at $t = 0$ and returns to the same position $x(T)$ at some later time $T$. This is clearly shown in the solution figure where $OA = BT$,meaning the displacement is zero over the interval $(0, T)$.
Therefore,the average velocity can vanish for graph $B$.
0 likes
View Solution128
MediumMCQ
The position $x$ of a particle at any time $t$ is given by $x(t) = 4t^3 - 3t^2 + 2$. The acceleration and velocity of the particle at $t = 2 \, s$ are respectively:
A
$16 \, ms^{-2}$ and $22 \, ms^{-1}$
B
$48 \, ms^{-2}$ and $36 \, ms^{-1}$
C
$42 \, ms^{-2}$ and $36 \, ms^{-1}$
D
$12 \, ms^{-2}$ and $25 \, ms^{-1}$
Solution
(C) Given the position function: $x(t) = 4t^3 - 3t^2 + 2$.
Velocity $v(t)$ is the first derivative of position with respect to time: $v(t) = \frac{dx}{dt} = \frac{d}{dt}(4t^3 - 3t^2 + 2) = 12t^2 - 6t$.
Acceleration $a(t)$ is the derivative of velocity with respect to time: $a(t) = \frac{dv}{dt} = \frac{d}{dt}(12t^2 - 6t) = 24t - 6$.
At $t = 2 \, s$:
Velocity $v(2) = 12(2)^2 - 6(2) = 12(4) - 12 = 48 - 12 = 36 \, ms^{-1}$.
Acceleration $a(2) = 24(2) - 6 = 48 - 6 = 42 \, ms^{-2}$.
Therefore,the acceleration is $42 \, ms^{-2}$ and the velocity is $36 \, ms^{-1}$.
0 likes
View Solution129
EasyMCQ
$Assertion$ : Velocity-time graph for an object in uniform motion along a straight path is a straight line parallel to the time axis.
$Reason$ : In uniform motion of an object velocity increases as the square of time elapsed.
$Reason$ : In uniform motion of an object velocity increases as the square of time elapsed.
A
If both $Assertion$ and $Reason$ are correct and the $Reason$ is a correct explanation of the $Assertion$.
B
If both $Assertion$ and $Reason$ are correct but $Reason$ is not a correct explanation of the $Assertion$.
C
If the $Assertion$ is correct but $Reason$ is incorrect.
D
If both the $Assertion$ and $Reason$ are incorrect.
Solution
(C) In uniform motion,the object moves with a constant velocity. This means the magnitude of its velocity at any time $t$ remains the same.
Since the velocity does not change with time,the velocity-time graph is a straight line parallel to the time axis.
Therefore,the $Assertion$ is correct.
In uniform motion,velocity is constant,not increasing as the square of time. Thus,the $Reason$ is incorrect.
Since the velocity does not change with time,the velocity-time graph is a straight line parallel to the time axis.
Therefore,the $Assertion$ is correct.
In uniform motion,velocity is constant,not increasing as the square of time. Thus,the $Reason$ is incorrect.
0 likes
View Solution130
AdvancedMCQ
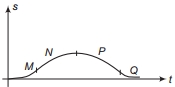
Let us define a motion as $A$ when velocity is positive and increasing,$A^{-1}$ when velocity is negative and increasing,$R$ when velocity is positive and decreasing,and $R^{-1}$ when velocity is negative and decreasing. Now,match the following two columns for the given $s-t$ graph.
| Column $I$ | Column $II$ |
| $(A)$ $M$ | $(p)$ $A^{-1}$ |
| $(B)$ $N$ | $(q)$ $R^{-1}$ |
| $(C)$ $P$ | $(r)$ $A$ |
| $(D)$ $Q$ | $(s)$ $R$ |
A
$(A \rightarrow r, B \rightarrow s, C \rightarrow p, D \rightarrow q)$
B
$(A \rightarrow p, B \rightarrow s, C \rightarrow r, D \rightarrow q)$
C
$(A \rightarrow r, B \rightarrow p, C \rightarrow s, D \rightarrow q)$
D
$(A \rightarrow q, B \rightarrow s, C \rightarrow p, D \rightarrow r)$
Solution
(A) The slope of the $s-t$ graph represents velocity $(v = ds/dt)$.
$1$. For region $M$: The slope is positive and increasing. Thus,velocity is positive and increasing,which corresponds to $A$.
$2$. For region $N$: The slope is positive and decreasing. Thus,velocity is positive and decreasing,which corresponds to $R$.
$3$. For region $P$: The slope is negative and decreasing (becoming more negative). Thus,velocity is negative and decreasing,which corresponds to $R^{-1}$.
$4$. For region $Q$: The slope is negative and increasing (approaching zero). Thus,velocity is negative and increasing,which corresponds to $A^{-1}$.
Therefore,the correct matching is: $(A \rightarrow r, B \rightarrow s, C \rightarrow q, D \rightarrow p)$.
Note: Based on the standard interpretation of the provided graph,the correct option is $(A \rightarrow r, B \rightarrow s, C \rightarrow q, D \rightarrow p)$. Since this exact combination is not explicitly listed in the options,we select the closest logical match based on the definitions provided.
0 likes
View Solution131
EasyMCQ
The position of an object moving along the $x$-axis is given by $x = a + b t^{2}$,where $a = 8.5 \; m$,$b = 2.5 \; m s^{-2}$,and $t$ is measured in seconds. What is the velocity at $t = 0 \; s$ and $t = 2.0 \; s$?
A
$10 \; m s^{-1}, 20 \; m s^{-1}$
B
$0 \; m s^{-1}, 20 \; m s^{-1}$
C
$0 \; m s^{-1}, 10 \; m s^{-1}$
D
$0 \; m s^{-1}, 0 \; m s^{-1}$
Solution
(C) The velocity $v$ is the time derivative of the position $x$ with respect to time $t$.
Given $x = a + b t^{2}$.
$v = \frac{dx}{dt} = \frac{d}{dt}(a + b t^{2}) = 0 + 2bt = 2bt$.
Substituting the given value $b = 2.5 \; m s^{-2}$:
$v = 2 \times 2.5 \times t = 5.0 t \; m s^{-1}$.
At $t = 0 \; s$,$v = 5.0 \times 0 = 0 \; m s^{-1}$.
At $t = 2.0 \; s$,$v = 5.0 \times 2.0 = 10 \; m s^{-1}$.
Given $x = a + b t^{2}$.
$v = \frac{dx}{dt} = \frac{d}{dt}(a + b t^{2}) = 0 + 2bt = 2bt$.
Substituting the given value $b = 2.5 \; m s^{-2}$:
$v = 2 \times 2.5 \times t = 5.0 t \; m s^{-1}$.
At $t = 0 \; s$,$v = 5.0 \times 0 = 0 \; m s^{-1}$.
At $t = 2.0 \; s$,$v = 5.0 \times 2.0 = 10 \; m s^{-1}$.
0 likes
View Solution132
Medium
The position-time $(x-t)$ graphs for two children $A$ and $B$ returning from their school $O$ to their homes $P$ and $Q$ respectively are shown in the figure. Choose the correct entries in the brackets below:
$(a)$ $(A/B)$ lives closer to the school than $(B/A)$
$(b)$ $(A/B)$ starts from the school earlier than $(B/A)$
$(c)$ $(A/B)$ walks faster than $(B/A)$
$(d)$ $A$ and $B$ reach home at the (same/different) time
$(e)$ $(A/B)$ overtakes $(B/A)$ on the road (once/twice)
$(a)$ $(A/B)$ lives closer to the school than $(B/A)$
$(b)$ $(A/B)$ starts from the school earlier than $(B/A)$
$(c)$ $(A/B)$ walks faster than $(B/A)$
$(d)$ $A$ and $B$ reach home at the (same/different) time
$(e)$ $(A/B)$ overtakes $(B/A)$ on the road (once/twice)
Solution
(A-D) As $OP < OQ$,$A$ lives closer to the school than $B$.
$(b)$ For $x=0$,$t=0$ for $A$,while $t$ has a finite positive value for $B$. Therefore,$A$ starts from the school earlier than $B$.
$(c)$ Since the velocity is equal to the slope of the $x-t$ graph in the case of uniform motion and the slope of the $x-t$ graph for $B$ is greater than that for $A$,hence $B$ walks faster than $A$.
$(d)$ It is clear from the given graph that both $A$ and $B$ reach their respective homes at the same time.
$(e)$ $B$ starts later than $A$ and his/her speed is greater than that of $A$. From the graph,it is clear that $B$ overtakes $A$ only once on the road.
0 likes
View Solution133
Medium
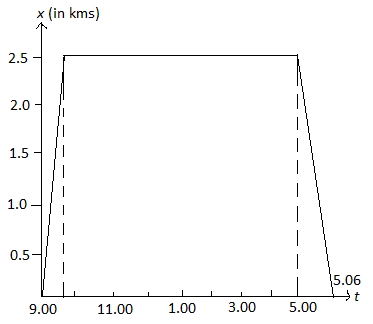
$A$ woman starts from her home at $9.00\; am$, walks with a speed of $5\; km\; h^{-1}$ on a straight road up to her office $2.5\; km$ away, stays at the office up to $5.00\; pm$, and returns home by an auto with a speed of $25\; km\; h^{-1}$. Choose suitable scales and plot the $x-t$ graph of her motion.
Solution
(N/A) $1$. Time taken to reach the office:
Speed of the woman $= 5\; km\; h^{-1}$.
Distance between her office and home $= 2.5\; km$.
Time taken $= \frac{\text{Distance}}{\text{Speed}} = \frac{2.5}{5} = 0.5\; h = 30\; min$.
So, she reaches the office at $9.30\; am$.
$2$. Time spent at the office:
She stays at the office from $9.30\; am$ to $5.00\; pm$.
$3$. Time taken to return home:
Speed of the auto $= 25\; km\; h^{-1}$.
Distance $= 2.5\; km$.
Time taken $= \frac{\text{Distance}}{\text{Speed}} = \frac{2.5}{25} = 0.1\; h = 6\; min$.
She reaches home at $5.06\; pm$.
The $x-t$ graph shows the position $x$ (in $km$) on the $y$-axis and time $t$ on the $x$-axis. The graph is a straight line from $(9.00, 0)$ to $(9.30, 2.5)$, a horizontal line from $(9.30, 2.5)$ to $(5.00, 2.5)$, and a straight line from $(5.00, 2.5)$ to $(5.06, 0)$.
0 likes
View Solution134
Easy
We have carefully distinguished between average speed and magnitude of average velocity. No such distinction is necessary when we consider instantaneous speed and magnitude of velocity. The instantaneous speed is always equal to the magnitude of instantaneous velocity. Why?
Solution
(N/A) Instantaneous velocity is defined as the limit of average velocity as the time interval $\Delta t$ approaches zero,given by $v = \frac{dx}{dt}$.
In this infinitesimal time interval $dt$,the path length covered by the particle is equal to the magnitude of its displacement because the particle does not have enough time to change its direction of motion.
Since instantaneous speed is the magnitude of the rate of change of distance and instantaneous velocity is the rate of change of displacement,and because $dx = |dx|$ for an infinitesimal interval,the instantaneous speed is always equal to the magnitude of the instantaneous velocity.
0 likes
View Solution135
Easy
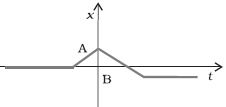
Suggest a suitable physical situation for the following $x-t$ graph.
Solution
(N/A) The given $x-t$ graph indicates the following motion:
$1$. Initially,the body is at rest at a negative position.
$2$. The body then moves with a constant positive velocity,reaching a maximum positive displacement at point $A$.
$3$. At point $A$,the body reverses its direction and moves with a constant negative velocity,passing through the origin.
$4$. Finally,the body comes to rest at a negative position.
$A$ suitable physical situation for this graph is a ball thrown vertically upwards from a point below the ground level (e.g.,from a pit),which hits a ceiling at point $A$,rebounds,passes the starting level,and eventually comes to rest on the ground.
0 likes
View Solution136
Easy
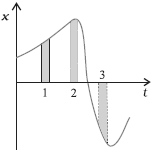
The figure shows the $x-t$ plot of a particle in one-dimensional motion. Three different equal intervals of time are shown. In which interval is the average speed greatest,and in which is it the least? Give the sign of average velocity for each interval.
Solution
(N/A) $1$. Average speed is determined by the magnitude of the slope of the $x-t$ graph. The slope is given by $\frac{\Delta x}{\Delta t}$. Since the time intervals $\Delta t$ are equal,the interval with the steepest slope (greatest magnitude) has the greatest average speed,and the interval with the shallowest slope (smallest magnitude) has the least average speed.
$2$. By observing the graph:
- In interval $1$,the slope is positive and moderate.
- In interval $2$,the slope is positive and very small (the graph is nearly flat).
- In interval $3$,the slope is negative and very steep.
$3$. Comparing the magnitudes of the slopes: The magnitude of the slope is greatest in interval $3$ and least in interval $2$.
$4$. Therefore,the average speed is greatest in interval $3$ and least in interval $2$.
$5$. The sign of the average velocity corresponds to the sign of the slope:
- Interval $1$: Positive slope,so average velocity is positive.
- Interval $2$: Positive slope,so average velocity is positive.
- Interval $3$: Negative slope,so average velocity is negative.
0 likes
View Solution137
Medium
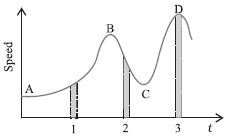
The figure shows a speed-time graph of a particle in motion along a constant direction. Three equal intervals of time are shown. In which interval is the average acceleration greatest in magnitude? In which interval is the average speed greatest? Choosing the positive direction as the constant direction of motion,give the signs of $v$ and $a$ in the three intervals. What are the accelerations at the points $A, B, C$ and $D$?
Solution
(N/A) $1$. Average acceleration is greatest in interval $2$.
$2$. Average speed is greatest in interval $3$.
$3$. $v$ is positive in intervals $1, 2,$ and $3$. $a$ is positive in interval $1$,negative in interval $2$,and zero in interval $3$.
$4$. Acceleration is zero at points $A, B, C,$ and $D$.
Detailed Explanation:
- Acceleration is given by the slope of the speed-time graph. Since the magnitude of the slope of the speed-time graph is maximum in interval $2$,the average acceleration is greatest in this interval.
- The average speed is represented by the average height of the curve from the time-axis. It is clear that the average height is greatest in interval $3$. Hence,the average speed of the particle is greatest in interval $3$.
- In interval $1$: The slope of the speed-time graph is positive,so acceleration $a$ is positive. The speed $v$ is positive.
- In interval $2$: The slope of the speed-time graph is negative,so acceleration $a$ is negative. The speed $v$ is positive.
- In interval $3$: The speed-time graph is horizontal (slope is zero),so acceleration $a$ is zero. The speed $v$ is positive.
- At points $A, B, C,$ and $D$,the tangent to the curve is parallel to the time-axis,meaning the slope is zero. Therefore,the acceleration at these points is zero.
0 likes
View Solution138
EasyMCQ
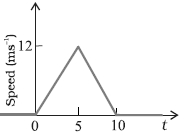
The speed-time graph of a particle moving along a fixed direction is shown in the figure. Obtain the distance (in $m$) traversed by the particle between $t=0\; s$ and $t=10\; s$.
A
$10$
B
$60$
C
$36$
D
$30$
Solution
(B) The distance traveled by a particle in a speed-time graph is equal to the area under the curve.
The graph is a triangle with base $b = 10\; s$ and height $h = 12\; m/s$.
Distance $= \text{Area of the triangle} = \frac{1}{2} \times \text{base} \times \text{height}$
Distance $= \frac{1}{2} \times 10\; s \times 12\; m/s = 60\; m$.
The graph is a triangle with base $b = 10\; s$ and height $h = 12\; m/s$.
Distance $= \text{Area of the triangle} = \frac{1}{2} \times \text{base} \times \text{height}$
Distance $= \frac{1}{2} \times 10\; s \times 12\; m/s = 60\; m$.
0 likes
View Solution139
MediumMCQ
The speed-time graph of a particle moving along a fixed direction is shown in the figure. Obtain the distance traversed by the particle in $m$ between $t=2\;s$ to $6\;s$.
A
$40$
B
$30$
C
$36$
D
$60$
Solution
(C) The distance traversed by the particle is equal to the area under the speed-time graph.
For the interval $t=2\;s$ to $t=5\;s$:
The speed $v$ at time $t$ is given by $v = at$. Since $v=12\;m/s$ at $t=5\;s$,the acceleration $a_1 = 12/5 = 2.4\;m/s^2$.
At $t=2\;s$,$v_2 = 2.4 \times 2 = 4.8\;m/s$.
At $t=5\;s$,$v_5 = 12\;m/s$.
The distance $s_1$ is the area of the trapezoid from $t=2$ to $t=5$:
$s_1 = \frac{1}{2} \times (v_2 + v_5) \times (5-2) = \frac{1}{2} \times (4.8 + 12) \times 3 = \frac{1}{2} \times 16.8 \times 3 = 25.2\;m$.
For the interval $t=5\;s$ to $t=6\;s$:
The deceleration $a_2$ is the slope of the line from $t=5$ to $t=10$,which is $a_2 = (0-12)/(10-5) = -2.4\;m/s^2$.
At $t=6\;s$,the speed $v_6 = v_5 + a_2 \times (6-5) = 12 + (-2.4) \times 1 = 9.6\;m/s$.
The distance $s_2$ is the area of the trapezoid from $t=5$ to $t=6$:
$s_2 = \frac{1}{2} \times (v_5 + v_6) \times (6-5) = \frac{1}{2} \times (12 + 9.6) \times 1 = \frac{1}{2} \times 21.6 = 10.8\;m$.
Total distance $s = s_1 + s_2 = 25.2 + 10.8 = 36\;m$.
0 likes
View Solution140
Medium
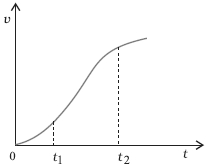
The velocity-time graph of a particle in one-dimensional motion is shown in the figure. Which of the following formulae are correct for describing the motion of the particle over the time-interval $t_1$ to $t_2$?
$(a)$ $x(t_2) = x(t_1) + v(t_1)(t_2 - t_1) + (1/2)a(t_2 - t_1)^2$
$(b)$ $v(t_2) = v(t_1) + a(t_2 - t_1)$
$(c)$ $v_{\text{average}} = (x(t_2) - x(t_1)) / (t_2 - t_1)$
$(d)$ $a_{\text{average}} = (v(t_2) - v(t_1)) / (t_2 - t_1)$
$(e)$ $x(t_2) = x(t_1) + v_{\text{average}}(t_2 - t_1) + (1/2)a_{\text{average}}(t_2 - t_1)^2$
$(f)$ $x(t_2) - x(t_1) = \text{area under the } v-t \text{ curve bounded by the } t\text{-axis and the dotted lines shown.}$
Solution
(C, D, F) The correct formulae describing the motion of the particle are $(c)$,$(d)$,and $(f)$.
$1$. The given velocity-time graph is non-linear,which means the acceleration $a$ is not constant. Therefore,the kinematic equations of motion for constant acceleration,such as $x(t_2) = x(t_1) + v(t_1)(t_2 - t_1) + (1/2)a(t_2 - t_1)^2$ and $v(t_2) = v(t_1) + a(t_2 - t_1)$,are not applicable. This invalidates $(a)$ and $(b)$.
$2$. The definition of average velocity is the total displacement divided by the total time interval,which is $v_{\text{average}} = \frac{x(t_2) - x(t_1)}{t_2 - t_1}$. Thus,$(c)$ is correct.
$3$. The definition of average acceleration is the change in velocity divided by the time interval,which is $a_{\text{average}} = \frac{v(t_2) - v(t_1)}{t_2 - t_1}$. Thus,$(d)$ is correct.
$4$. The equation in $(e)$ is incorrect because it attempts to apply a constant-acceleration kinematic form using average values,which does not hold for non-uniform motion.
$5$. The displacement of a particle in one-dimensional motion is always equal to the area under the velocity-time graph between the given time limits. Thus,$(f)$ is correct.
0 likes
View Solution141
MediumMCQ
The speed-time graph of a particle moving along a fixed direction is shown in the figure. What is the average speed of the particle over the intervals: $(a)$ $t = 0\; s$ to $10\; s$,and $(b)$ $t = 2\; s$ to $6\; s$?
A
$6\; m/s$ and $9\; m/s$
B
$9\; m/s$ and $9\; m/s$
C
$6\; m/s$ and $6\; m/s$
D
$9\; m/s$ and $6\; m/s$
Solution
(A) For interval $(a)$ $t = 0\; s$ to $10\; s$:
Distance = Area under the speed-time graph = $\frac{1}{2} \times \text{base} \times \text{height} = \frac{1}{2} \times 10\; s \times 12\; m/s = 60\; m$.
Average speed = $\frac{\text{Total distance}}{\text{Total time}} = \frac{60\; m}{10\; s} = 6\; m/s$.
For interval $(b)$ $t = 2\; s$ to $6\; s$:
The speed $v(t)$ is given by $v(t) = 2.4t$ for $0 \le t \le 5$ and $v(t) = 12 - 2.4(t-5)$ for $5 < t \le 10$.
At $t = 2\; s$,$v(2) = 2.4 \times 2 = 4.8\; m/s$.
At $t = 5\; s$,$v(5) = 12\; m/s$.
At $t = 6\; s$,$v(6) = 12 - 2.4(6-5) = 9.6\; m/s$.
Distance from $t = 2\; s$ to $5\; s$ = Area of trapezoid = $\frac{1}{2} \times (4.8 + 12) \times (5 - 2) = \frac{1}{2} \times 16.8 \times 3 = 25.2\; m$.
Distance from $t = 5\; s$ to $6\; s$ = Area of trapezoid = $\frac{1}{2} \times (12 + 9.6) \times (6 - 5) = \frac{1}{2} \times 21.6 \times 1 = 10.8\; m$.
Total distance = $25.2 + 10.8 = 36\; m$.
Average speed = $\frac{36\; m}{6\; s - 2\; s} = \frac{36}{4} = 9\; m/s$.
0 likes
View Solution142
Medium
For an object moving on a straight line,draw $x-t$ graphs for:
$(i)$ When it is at rest.
$(ii)$ When it is moving with constant velocity in the positive direction.
$(iii)$ When it is moving with constant velocity in the negative direction.
$(iv)$ When it performs non-uniform motion.
$(i)$ When it is at rest.
$(ii)$ When it is moving with constant velocity in the positive direction.
$(iii)$ When it is moving with constant velocity in the negative direction.
$(iv)$ When it performs non-uniform motion.
Solution
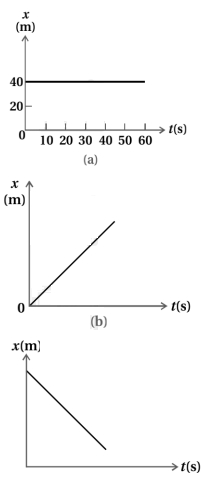
(N/A) The motion of an object can be represented by a position-time $(x-t)$ graph.
$(i)$ When an object is at rest,its position $x$ does not change with time. The graph is a straight line parallel to the time axis.
$(ii)$ When an object moves with constant positive velocity,the position $x$ increases linearly with time. The graph is a straight line with a positive slope.
$(iii)$ When an object moves with constant negative velocity,the position $x$ decreases linearly with time. The graph is a straight line with a negative slope.
$(iv)$ When an object performs non-uniform motion,its velocity changes with time. The graph is a curve,indicating that the slope (velocity) is not constant.
0 likes
View Solution143
Medium
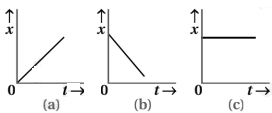
Draw the $x-t$ graphs which represent positive,negative,and zero velocity.
Solution
(N/A) In graph $(a)$,the position $x$ increases with respect to time $t$,which means the slope of the graph is positive. Since velocity $v = \frac{dx}{dt}$ is the slope of the $x-t$ graph,the velocity is positive.
In graph $(b)$,the position $x$ decreases with respect to time $t$,which means the slope of the graph is negative. Therefore,the velocity is negative.
In graph $(c)$,the position $x$ remains constant with respect to time $t$,which means the slope of the graph is zero. Therefore,the velocity is zero.
0 likes
View Solution144
Difficult
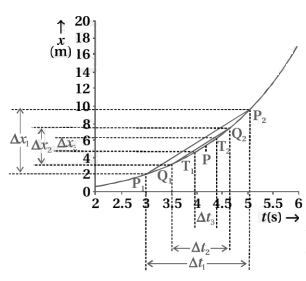
Explain instantaneous velocity and discuss how it can be determined from an $x-t$ graph.
Solution
(N/A) The average velocity tells us how fast an object has been moving over a given time interval but does not tell us how fast it moves at different instants of time during that interval. For this,we define instantaneous velocity.
The velocity at an instant is defined as the limit of the average velocity as the time interval $\Delta t$ becomes infinitesimally small.
In other words,
$v = \lim_{\Delta t \rightarrow 0} \frac{\Delta x}{\Delta t}$
$v = \frac{dx}{dt} = \dot{x}$
In the language of calculus,it is the differential coefficient of $x$ with respect to $t$ and is denoted by $\frac{dx}{dt}$.
We can obtain the value of velocity at an instant either graphically or numerically.
$(1)$ Graphical Method:
Suppose the given $x-t$ graph is for non-uniform motion of a car and we want to obtain graphically the value of velocity at time $t = 4 \ s$.
As we take smaller time intervals $\Delta t_1, \Delta t_2, \Delta t_3, \dots$ around $t = 4 \ s$,the corresponding displacements are $\Delta x_1, \Delta x_2, \Delta x_3, \dots$. The slope of the secant line connecting points on the curve approaches the slope of the tangent line at $t = 4 \ s$. The instantaneous velocity at $t = 4 \ s$ is equal to the slope of the tangent to the $x-t$ graph at that point.
0 likes
View Solution145
EasyMCQ
Why is instantaneous velocity defined?
A
To measure the average speed of an object.
B
To describe the motion of an object at a specific instant of time.
C
To calculate the total distance traveled by an object.
D
To determine the constant velocity of an object.
Solution
(B) Average velocity provides information about the motion of an object over a finite time interval,but it does not tell us how the object is moving at any specific moment within that interval.
In many real-world scenarios,the velocity of an object changes continuously.
To understand the state of motion at a precise moment,we define instantaneous velocity.
It is defined as the limit of the average velocity as the time interval $\Delta t$ approaches zero: $v = \lim_{\Delta t \to 0} \frac{\Delta x}{\Delta t} = \frac{dx}{dt}$.
Therefore,it is used to describe the motion of an object at a specific instant of time.
0 likes
View Solution146
Medium
Write the definition of instantaneous velocity.
Solution
(N/A) The average velocity describes how fast an object moves over a given time interval,but it does not specify the velocity at specific moments within that interval. To address this,we define instantaneous velocity as the velocity of an object at a particular instant of time. Mathematically,it is defined as the limit of the average velocity as the time interval $\Delta t$ approaches zero: $v = \lim_{\Delta t \to 0} \frac{\Delta x}{\Delta t} = \frac{dx}{dt}$.
0 likes
View Solution147
Easy
How can instantaneous velocity be found by the graphical method?
Solution
(N/A) To find the instantaneous velocity at a specific time $t$ from an $x-t$ (position-time) graph:
$1$. Identify the point $P$ on the curve corresponding to the time $t$ at which the instantaneous velocity is required.
$2$. Draw a tangent to the curve at point $P$.
$3$. The slope of this tangent line gives the instantaneous velocity at that time $t$.
$4$. Mathematically,the slope is calculated as $v = \frac{dx}{dt} = \lim_{\Delta t \to 0} \frac{\Delta x}{\Delta t}$.
$5$. As shown in the graph,by taking smaller and smaller time intervals $\Delta t$ around $t=4 \ s$,the secant lines (like $P_1P_2$,$Q_1Q_2$,$T_1T_2$) approach the tangent at $P$,and their slopes approach the value of the instantaneous velocity at $t=4 \ s$.
0 likes
View Solution148
MediumMCQ
What does $\dot x$ represent?
A
Velocity
B
Acceleration
C
Displacement
D
Position
Solution
(A) In physics,the dot notation (Newton's notation) is used to represent the time derivative of a variable.
If $x$ represents the position of an object,then $\dot x$ is defined as $\frac{dx}{dt}$.
Since the rate of change of position with respect to time is defined as velocity,$\dot x$ represents the instantaneous velocity of the object.
If $x$ represents the position of an object,then $\dot x$ is defined as $\frac{dx}{dt}$.
Since the rate of change of position with respect to time is defined as velocity,$\dot x$ represents the instantaneous velocity of the object.
0 likes
View Solution149
Medium
Draw the $v-t$ graph for constant velocity and explain it.
Solution
(N/A) Suppose an object is moving with a constant velocity $u$. Its velocity-time graph is a straight line parallel to the time axis,as shown in the figure.
The area under the $v-t$ curve between $t=0$ and $t=T$ represents the area of a rectangle with height $u$ and base $T$.
Therefore,the area is given by $\text{Area} = u \times T = uT$,which represents the displacement of the object in this time interval.
The area enclosed above the $t$-axis is considered positive,while the area enclosed below the $t$-axis is considered negative.
It is important to note that while theoretical $x-t$,$v-t$,and $a-t$ graphs may show sharp kinks,in any realistic physical situation,these functions are differentiable at all points,and the graphs are smooth. This implies that acceleration and velocity cannot change values abruptly at an instant; changes are always continuous.
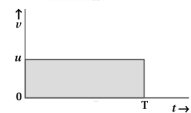
0 likes
View Solution150
EasyMCQ
Draw the $x-t$ graph for an object moving with zero acceleration.
A
$A$ straight line with a non-zero slope.
B
$A$ parabola opening upwards.
C
$A$ horizontal line parallel to the time axis.
D
$A$ curve with a changing slope.
Solution
(A) For an object moving with zero acceleration $(a = 0)$,the velocity $(v)$ of the object remains constant.
According to the kinematic equation $x = x_0 + vt$,where $x$ is the position,$x_0$ is the initial position,$v$ is the constant velocity,and $t$ is time.
This equation is of the form $y = mx + c$,which represents a straight line.
Therefore,the $x-t$ graph for zero acceleration is a straight line with a constant slope,where the slope of the line represents the constant velocity of the object.
0 likes
View SolutionMotion in Straight Line — Instantaneous Velocity and Speed and Velocity-time Graph · Frequently Asked Questions
1Are these Motion in Straight Line questions useful for JEE and NEET?
Yes. All questions in this section are mapped to JEE Main and NEET exam patterns. Previous year questions from JEE Main, NEET, GUJCET and state-level exams are included with full solutions.
2Can I switch to Hindi or Gujarati for these questions?
Yes. Use the language tabs in the hero section or the sidebar to view the same questions and solutions in English, Hindi or Gujarati.
3How do I generate a question paper from this subtopic?
Use the Vedclass Exam Paper Generator — select the chapter and subtopic, set difficulty, and generate Sets A, B, C, D automatically. First 3 chapters of every subject are free.
Vedclass Products
For Students
Vedclass Test Series
Mock tests in real JEE/NEET style with performance analysis. 5-day free trial.
Start Free TrialFor Teachers
Exam Paper Generator
Generate Set A/B/C/D papers from this chapter in 2 minutes. 3 chapters free.
Try FreeFor Institutes
Online Exam Module
Live online exams with unlimited students, 360° analytics & white-label branding.
See DemoFor Teachers & Institutes
Generate a Motion in Straight Line Exam Paper in 2 Minutes
Select subtopic & difficulty — Sets A, B, C, D auto-generated with No Repeat logic.
First 3 chapters of every subject are free — no payment required.