
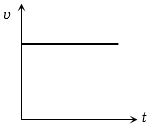
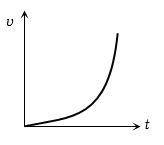
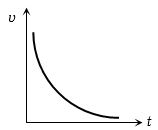
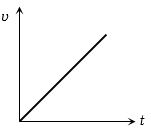
Which of the following velocity-time graphs represents uniform motion?
- A
- B
- C
- D
Explore More
Similar Questions
The acceleration-time graph of a body is shown below. The most probable velocity-time graph of the body is:
Difficult
View SolutionThe speed-time graph of a particle moving along a fixed direction is shown in the figure. The distance traversed by the particle between $t = 2\,s$ to $t = 6\,s$ is........$m$
Difficult
View SolutionFor the velocity-time graph shown in the figure,the distance covered by the body in the last two seconds of its motion is $S_1$. What is the ratio of $S_1$ to the total distance covered by it?
The speed-time graph of a particle moving along a fixed direction is shown in the figure. Obtain the distance (in $m$) traversed by the particle between $t=0\; s$ and $t=10\; s$.
Easy
View Solution$A$ lift is moving upwards. Its velocity-time graph is given. The distance covered by the lift is ........ $m$.
Difficult
View SolutionVedclass Products
For Students
Vedclass Test Series
Mock tests in real JEE/NEET style with performance analysis. 5-day free trial.
Start Free TrialFor Teachers
Exam Paper Generator
Generate Set A/B/C/D exam papers from 7.5L+ questions in 2 minutes. 3 chapters free.
Try FreeFor Institutes
Online Exam Module
Live online exams with unlimited students, 360° analytics & white-label branding.
See Demo