
A English
Instantaneous Velocity and Speed and Velocity-time Graph Questions in English
Class 11 Physics · Motion in Straight Line · Instantaneous Velocity and Speed and Velocity-time Graph
244+
Questions
English
Language
100%
With Solutions
Showing 50 of 244 questions in English
151
EasyMCQ
Draw the $x-t$ graph for positive acceleration.
A
$A$ parabola opening upwards.
B
$A$ straight line with positive slope.
C
$A$ straight line with negative slope.
D
$A$ parabola opening downwards.
Solution
(A) For motion with constant positive acceleration $a > 0$,the equation of motion is given by $x(t) = x_0 + v_0 t + \frac{1}{2} a t^2$.
Since the equation is quadratic in $t$ with a positive coefficient for $t^2$,the $x-t$ graph is a parabola that opens upwards.
The slope of the tangent to this curve represents the velocity,which increases linearly with time.
Since the equation is quadratic in $t$ with a positive coefficient for $t^2$,the $x-t$ graph is a parabola that opens upwards.
The slope of the tangent to this curve represents the velocity,which increases linearly with time.
0 likes
View Solution152
EasyMCQ
What does the area of $v-t$ graph of a moving object represent?
A
Distance
B
Displacement
C
Acceleration
D
Velocity
Solution
(B) The area under a velocity-time $(v-t)$ graph represents the displacement of the object.
Mathematically,the area is given by the integral $\int v \, dt$,which is equal to the change in position or displacement $(\Delta x)$ of the object over the given time interval.
Mathematically,the area is given by the integral $\int v \, dt$,which is equal to the change in position or displacement $(\Delta x)$ of the object over the given time interval.
0 likes
View Solution153
Medium
Can the position-time graph of a moving object be parallel to the position axis? Why?
Solution
(B) No,the position-time graph of a moving object cannot be parallel to the position axis.
If the graph were parallel to the position axis,it would imply that the object is at multiple positions at the same instant of time.
This would mean the velocity of the object is infinite,which is physically impossible for a moving object.
If the graph were parallel to the position axis,it would imply that the object is at multiple positions at the same instant of time.
This would mean the velocity of the object is infinite,which is physically impossible for a moving object.
0 likes
View Solution154
EasyMCQ
What does the area enclosed by the acceleration-time graph for any time interval represent?
A
Displacement
B
Change in velocity
C
Average velocity
D
Distance
Solution
(B) The acceleration-time graph represents the acceleration $a$ on the $y$-axis and time $t$ on the $x$-axis.
The area under the acceleration-time graph is given by the integral $\int a \, dt$.
Since $a = \frac{dv}{dt}$,we have $dv = a \, dt$.
Integrating both sides,$\int_{v_1}^{v_2} dv = \int_{t_1}^{t_2} a \, dt$,which gives $\Delta v = v_2 - v_1$.
Therefore,the area under the acceleration-time graph represents the change in velocity of the particle during the given time interval.
0 likes
View Solution155
MediumMCQ
What do the slope and the area under the $v-t$ graph represent?
A
Slope represents acceleration,area represents displacement.
B
Slope represents velocity,area represents acceleration.
C
Slope represents displacement,area represents velocity.
D
Slope represents acceleration,area represents distance.
Solution
(A) The slope of the $v-t$ graph is given by $\frac{\Delta v}{\Delta t}$,which represents acceleration.
The area under the $v-t$ graph represents the displacement of the object.
The area under the $v-t$ graph represents the displacement of the object.
0 likes
View Solution156
MediumMCQ
What does a vehicle's speedometer measure: instantaneous velocity or instantaneous speed?
A
Instantaneous velocity
B
Instantaneous speed
C
Average velocity
D
Average speed
Solution
(B) speedometer measures the magnitude of the velocity at a specific instant of time,which is defined as instantaneous speed. It does not provide information about the direction of motion,so it cannot measure velocity.
0 likes
View Solution157
MediumMCQ
If the position-time graph of a moving object is a straight line,determine the acceleration and velocity at any point.
A
Acceleration is zero,velocity is constant.
B
Acceleration is constant,velocity is zero.
C
Acceleration is constant,velocity is constant.
D
Acceleration is zero,velocity is zero.
Solution
(A) The slope of a position-time graph represents the velocity of the object.
Since the graph is a straight line,its slope is constant,which means the velocity of the object is constant.
Acceleration is defined as the rate of change of velocity.
Since the velocity is constant,the rate of change of velocity is zero.
Therefore,the acceleration of the object is $0 \ m/s^2$ and the velocity is constant.
0 likes
View Solution158
MediumMCQ
The $v-t$ graphs of two moving objects make angles of $30^{\circ}$ and $45^{\circ}$ with the time axis. Find the ratio of their accelerations.
A
$1 : \sqrt{3}$
B
$\sqrt{3} : 1$
C
$1 : 1$
D
$1 : 3$
Solution
(A) The slope of a $v-t$ graph represents the acceleration of the object.
Slope $a = \tan \theta$,where $\theta$ is the angle made with the time axis.
Given $\theta_{1} = 30^{\circ}$ and $\theta_{2} = 45^{\circ}$.
The ratio of their accelerations is $\frac{a_{1}}{a_{2}} = \frac{\tan \theta_{1}}{\tan \theta_{2}}$.
Substituting the values: $\frac{a_{1}}{a_{2}} = \frac{\tan 30^{\circ}}{\tan 45^{\circ}}$.
Since $\tan 30^{\circ} = \frac{1}{\sqrt{3}}$ and $\tan 45^{\circ} = 1$,we get $\frac{a_{1}}{a_{2}} = \frac{1/\sqrt{3}}{1} = \frac{1}{\sqrt{3}}$.
Therefore,the ratio is $1 : \sqrt{3}$.
0 likes
View Solution159
Easy
Is the statement 'The slope of a position-time graph can be negative' true or false?
Solution
(A) The statement is true.
The slope of a position-time graph represents the velocity of the object.
If the velocity of the object is negative (i.e.,the object is moving in the direction opposite to the chosen positive direction),the slope of the $x-t$ graph will be negative.
The slope of a position-time graph represents the velocity of the object.
If the velocity of the object is negative (i.e.,the object is moving in the direction opposite to the chosen positive direction),the slope of the $x-t$ graph will be negative.
0 likes
View Solution160
MediumMCQ
Constant acceleration means the slope of the $x-t$ graph is constant. True or False?
A
True
B
False
Solution
(B) The slope of the $x-t$ graph represents the velocity of the object.
If the acceleration is constant,the velocity changes at a constant rate,meaning the velocity is not constant.
Since the velocity is the slope of the $x-t$ graph,a changing velocity implies that the slope of the $x-t$ graph is changing.
Therefore,the $x-t$ graph for constant acceleration is a parabola,not a straight line.
Thus,the statement is False.
0 likes
View Solution161
Medium
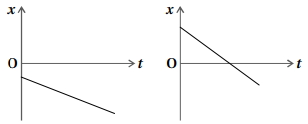
What is common in the two graphs given below?
Solution
(N/A) The slope of a position-time $(x-t)$ graph represents the velocity of the object.
In both given graphs,the slope is constant and negative.
Since the slope is negative,the velocity of the object is negative in both cases.
In both given graphs,the slope is constant and negative.
Since the slope is negative,the velocity of the object is negative in both cases.
0 likes
View Solution162
Medium
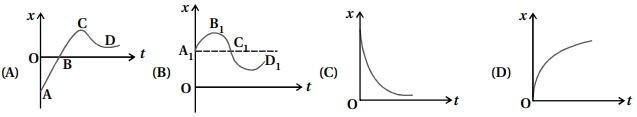
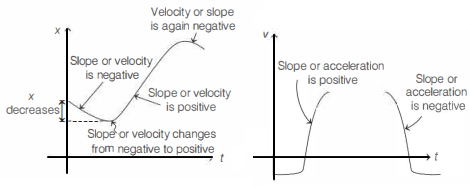
Refer to the graph in figure. Match the following:
| Graph | Characteristics |
| $(A)$ | $(i)$ has $v > 0$ and $a < 0$ throughout |
| $(B)$ | $(ii)$ has $x > 0$ throughout and has a point with $v = 0$ and a point with $a = 0$ |
| $(C)$ | $(iii)$ has a point with zero displacement for $t > 0$ |
| $(D)$ | $(iv)$ has $v < 0$ and $a > 0$ |
Solution
(A-III, B-II, C-IV, D-I) We analyze the slope of each curve,which represents velocity $v = \frac{dx}{dt}$,and the curvature,which relates to acceleration $a = \frac{d^2x}{dt^2}$.
$1$. Graph $(A)$: The curve crosses the $t$-axis at point $B$,meaning displacement $x = 0$ for some $t > 0$. Thus,$(A)$ matches $(iii)$.
$2$. Graph $(B)$: The curve stays above the $t$-axis $(x > 0)$. It has a peak at $B_1$ where slope $v = 0$. It also has a point of inflection between $B_1$ and $C_1$ where the curvature changes,meaning $a = 0$. Thus,$(B)$ matches $(ii)$.
$3$. Graph $(C)$: The slope is negative throughout $(v < 0)$ and the curve is concave up (slope becomes less negative),meaning $a > 0$. Thus,$(C)$ matches $(iv)$.
$4$. Graph $(D)$: The slope is positive $(v > 0)$ and the curve is concave down (slope decreases),meaning $a < 0$. Thus,$(D)$ matches $(i)$.
Final matching: $(A)-(iii), (B)-(ii), (C)-(iv), (D)-(i)$.
0 likes
View Solution163
Easy
Explain instantaneous velocity.
Solution
(N/A) Instantaneous velocity is defined as the velocity of an object at a specific instant of time or at a specific point in its path.
Mathematically,it is the limit of the average velocity as the time interval $\Delta t$ approaches zero.
It is expressed as: $v = \lim_{\Delta t \to 0} \frac{\Delta x}{\Delta t} = \frac{dx}{dt}$.
Here,$dx$ is the infinitesimal displacement and $dt$ is the infinitesimal time interval.
Graphically,the instantaneous velocity at any point on a position-time graph is equal to the slope of the tangent drawn to the curve at that specific point.
0 likes
View Solution164
Difficult
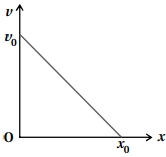
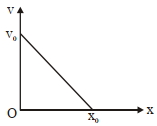
The velocity-displacement graph of a particle is shown in the figure.
$(a)$ Write the relation between $v$ and $x$.
$(b)$ Obtain the relation between acceleration and displacement and plot it.
$(a)$ Write the relation between $v$ and $x$.
$(b)$ Obtain the relation between acceleration and displacement and plot it.
Solution
(N/A) From the graph,the initial velocity is $v_{0}$ at $x=0$ and the velocity is $0$ at $x=x_{0}$.
$(a)$ The equation of a straight line with intercept $v_{0}$ on the $v$-axis and intercept $x_{0}$ on the $x$-axis is given by the intercept form:
$\frac{v}{v_{0}} + \frac{x}{x_{0}} = 1$
$v = v_{0} \left(1 - \frac{x}{x_{0}}\right) = v_{0} - \frac{v_{0}}{x_{0}}x$
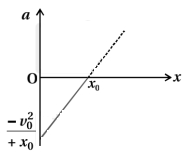
$(b)$ We know that acceleration $a = v \frac{dv}{dx}$.
From the relation $v = v_{0} - \frac{v_{0}}{x_{0}}x$,we differentiate with respect to $x$:
$\frac{dv}{dx} = -\frac{v_{0}}{x_{0}}$
Substituting these into the expression for $a$:
$a = \left(v_{0} - \frac{v_{0}}{x_{0}}x\right) \left(-\frac{v_{0}}{x_{0}}\right)$
$a = -\frac{v_{0}^{2}}{x_{0}} + \frac{v_{0}^{2}}{x_{0}^{2}}x$
This is a linear equation of the form $a = mx + c$,where the slope is $\frac{v_{0}^{2}}{x_{0}^{2}}$ and the intercept is $-\frac{v_{0}^{2}}{x_{0}}$. The graph is a straight line starting from $-\frac{v_{0}^{2}}{x_{0}}$ at $x=0$ and passing through $x=x_{0}$ at $a=0$.
$(a)$ The equation of a straight line with intercept $v_{0}$ on the $v$-axis and intercept $x_{0}$ on the $x$-axis is given by the intercept form:
$\frac{v}{v_{0}} + \frac{x}{x_{0}} = 1$
$v = v_{0} \left(1 - \frac{x}{x_{0}}\right) = v_{0} - \frac{v_{0}}{x_{0}}x$
$(b)$ We know that acceleration $a = v \frac{dv}{dx}$.
From the relation $v = v_{0} - \frac{v_{0}}{x_{0}}x$,we differentiate with respect to $x$:
$\frac{dv}{dx} = -\frac{v_{0}}{x_{0}}$
Substituting these into the expression for $a$:
$a = \left(v_{0} - \frac{v_{0}}{x_{0}}x\right) \left(-\frac{v_{0}}{x_{0}}\right)$
$a = -\frac{v_{0}^{2}}{x_{0}} + \frac{v_{0}^{2}}{x_{0}^{2}}x$
This is a linear equation of the form $a = mx + c$,where the slope is $\frac{v_{0}^{2}}{x_{0}^{2}}$ and the intercept is $-\frac{v_{0}^{2}}{x_{0}}$. The graph is a straight line starting from $-\frac{v_{0}^{2}}{x_{0}}$ at $x=0$ and passing through $x=x_{0}$ at $a=0$.
0 likes
View Solution165
Medium
Fill in the blanks:
$(a)$ The path length is always ............ .
$(b)$ The slope of the velocity-time graph for an object moving with acceleration is ............ .
$(c)$ If the velocity-time graph is parallel to the time-axis,the object is ............ .
$(a)$ The path length is always ............ .
$(b)$ The slope of the velocity-time graph for an object moving with acceleration is ............ .
$(c)$ If the velocity-time graph is parallel to the time-axis,the object is ............ .
Solution
(N/A) The path length is always positive.
$(b)$ The slope of the velocity-time graph for an object moving with acceleration is constant and non-zero (representing acceleration).
$(c)$ If the velocity-time graph is parallel to the time-axis,the velocity is constant,meaning the object is moving with uniform velocity (zero acceleration).
$(b)$ The slope of the velocity-time graph for an object moving with acceleration is constant and non-zero (representing acceleration).
$(c)$ If the velocity-time graph is parallel to the time-axis,the velocity is constant,meaning the object is moving with uniform velocity (zero acceleration).
0 likes
View Solution166
Easy
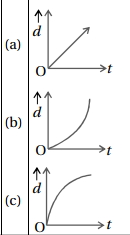
Match Column-$I$ with Column-$II$ based on the distance-time $(d-t)$ graphs provided in the image.
| $(1)$ Velocity decreases | $(a)$ Linear graph (constant slope) |
| $(2)$ Velocity increases | $(b)$ Concave up graph (increasing slope) |
| $(3)$ Velocity is constant | $(c)$ Concave down graph (decreasing slope) |
Solution
(A) The slope of a distance-time $(d-t)$ graph represents the velocity of the object.
$(1)$ Velocity decreases: This corresponds to a concave down curve where the slope decreases with time. This matches graph $(c)$.
$(2)$ Velocity increases: This corresponds to a concave up curve where the slope increases with time. This matches graph $(b)$.
$(3)$ Velocity is constant: This corresponds to a straight line with a constant slope. This matches graph $(a)$.
Therefore,the correct matching is $(1-c, 2-b, 3-a)$.
0 likes
View Solution167
Medium
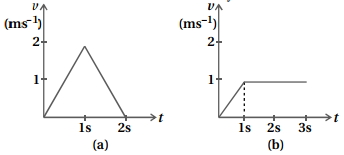
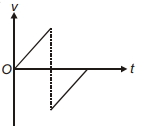
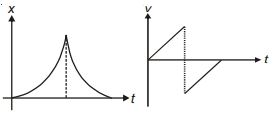
The figure shows $(v_x, t)$ and $(v_y, t)$ diagrams for a body of unit mass $(m = 1 \text{ kg})$. Find the force as a function of time.
Solution
(N/A) Given: Mass $m = 1 \text{ kg}$.
Force $\vec{F} = m\vec{a} = 1 \cdot (a_x \hat{i} + a_y \hat{j}) = a_x \hat{i} + a_y \hat{j}$.
For $v_x - t$ graph $(a)$:
$1$. For $0 \le t \le 1 \text{ s}$,slope $a_x = \frac{2 - 0}{1 - 0} = 2 \text{ m/s}^2$. Thus,$F_x = 1 \times 2 = 2 \text{ N}$.
$2$. For $1 \le t \le 2 \text{ s}$,slope $a_x = \frac{0 - 2}{2 - 1} = -2 \text{ m/s}^2$. Thus,$F_x = 1 \times (-2) = -2 \text{ N}$.
For $v_y - t$ graph $(b)$:
$1$. For $0 \le t \le 1 \text{ s}$,slope $a_y = \frac{1 - 0}{1 - 0} = 1 \text{ m/s}^2$. Thus,$F_y = 1 \times 1 = 1 \text{ N}$.
$2$. For $t > 1 \text{ s}$,velocity is constant,so $a_y = 0$. Thus,$F_y = 0 \text{ N}$.
Resultant Force $\vec{F}(t)$:
- For $0 \le t \le 1 \text{ s}: \vec{F} = 2\hat{i} + 1\hat{j} \text{ N}$.
- For $1 < t \le 2 \text{ s}: \vec{F} = -2\hat{i} + 0\hat{j} = -2\hat{i} \text{ N}$.
- For $t > 2 \text{ s}: \vec{F} = 0\hat{i} + 0\hat{j} = 0 \text{ N}$.
0 likes
View Solution168
EasyMCQ
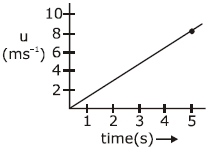
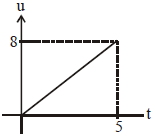
The speed versus time graph for a particle is shown in the figure. The distance travelled (in $m$) by the particle during the time interval $t=0$ to $t=5\, s$ will be
A
$25$
B
$20$
C
$35$
D
$30$
Solution
(B) The distance travelled by a particle is equal to the area under the speed-time graph.
From the given graph,the shape formed is a right-angled triangle with base $b = 5\, s$ and height $h = 8\, m/s$.
Distance $= \text{Area of triangle} = \frac{1}{2} \times \text{base} \times \text{height}$
Distance $= \frac{1}{2} \times 5\, s \times 8\, m/s = 20\, m$.
Therefore,the distance travelled by the particle is $20\, m$.
0 likes
View Solution169
MediumMCQ
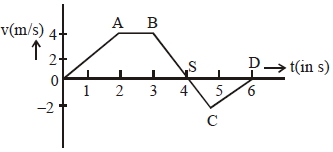
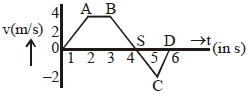
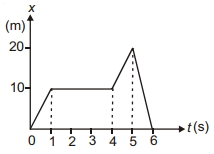
The velocity $(v)$ and time $(t)$ graph of a body in a straight line motion is shown in the figure. The point $S$ is at $4.333 \; s$. The total distance covered by the body in $6 \; s$ is $....... \; m$.
A
$12$
B
$\frac{49}{4} \; m$
C
$11$
D
$\frac{37}{3} \; m$
Solution
(A) The total distance covered is the sum of the magnitudes of the areas under the velocity-time graph.
$1$. Area $A_1$ (from $t=0$ to $t=4$): This is a trapezoid with parallel sides of length $4 \; s$ and $1 \; s$,and height $4 \; m/s$.
$A_1 = \frac{1}{2} \times (4 + 1) \times 4 = 10 \; m$.
$2$. Area $A_2$ (from $t=4$ to $t=6$): This is a triangle with base $(6 - 4) = 2 \; s$ and height $2 \; m/s$.
$A_2 = \frac{1}{2} \times 2 \times 2 = 2 \; m$.
Total distance $= |A_1| + |A_2| = 10 + 2 = 12 \; m$.
0 likes
View Solution170
DifficultMCQ
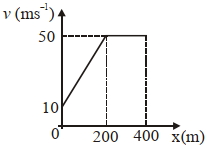
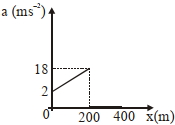
The velocity-displacement graph describing the motion of a bicycle is shown in the figure. The acceleration-displacement graph of the bicycle's motion is best described by:
A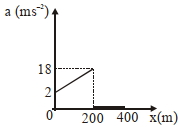
B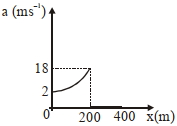
C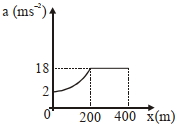
D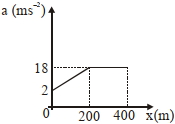
Solution
(A) From the given velocity-displacement graph,for $0 \leq x \leq 200 \ m$,the graph is a straight line passing through $(0, 10)$ and $(200, 50)$.
The equation of the line is $v = mx + C$.
Slope $m = \frac{50 - 10}{200 - 0} = \frac{40}{200} = \frac{1}{5} \ m^{-1}s^{-1}$.
Intercept $C = 10 \ m/s$.
So,$v = \frac{1}{5}x + 10$.
Acceleration $a = v \frac{dv}{dx} = (\frac{1}{5}x + 10) \frac{d}{dx}(\frac{1}{5}x + 10) = (\frac{1}{5}x + 10)(\frac{1}{5}) = \frac{x}{25} + 2$.
At $x = 0$,$a = 2 \ m/s^2$.
At $x = 200$,$a = \frac{200}{25} + 2 = 8 + 2 = 10 \ m/s^2$.
For $x > 200 \ m$,$v = 50 \ m/s$ (constant).
Since $v$ is constant,$a = \frac{dv}{dt} = 0$.
Comparing this with the given options,option $A$ is the closest representation of the calculated values,noting that the peak value in the provided graph image is $18 \ m/s^2$ which corresponds to a different slope calculation if we assume the graph values are fixed. Based on the linear relationship $a = \frac{x}{25} + 2$,the acceleration increases linearly.
0 likes
View Solution171
DifficultMCQ
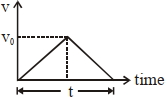
$A$ car accelerates from rest at a constant rate $\alpha$ for some time after which it decelerates at a constant rate $\beta$ to come to rest. If the total time elapsed is $t$ seconds,the total distance travelled is
A
$\frac{4 \alpha \beta}{(\alpha+\beta)} t ^{2}$
B
$\frac{2 \alpha \beta}{(\alpha+\beta)} t ^{2}$
C
$\frac{\alpha \beta}{2(\alpha+\beta)} t ^{2}$
D
$\frac{\alpha \beta}{4(\alpha+\beta)} t ^{2}$
Solution
(C) Let $t _{1}$ be the time of acceleration and $t _{2}$ be the time of deceleration. The maximum velocity reached is $v _{0}$.
From the equations of motion:
$v _{0} = \alpha t _{1} \Rightarrow t _{1} = \frac{v _{0}}{\alpha}$
$0 = v _{0} - \beta t _{2} \Rightarrow t _{2} = \frac{v _{0}}{\beta}$
Given that the total time is $t = t _{1} + t _{2}$,we have:
$t = \frac{v _{0}}{\alpha} + \frac{v _{0}}{\beta} = v _{0} \left( \frac{\alpha + \beta}{\alpha \beta} \right)$
Thus,the maximum velocity is $v _{0} = \frac{\alpha \beta t}{\alpha + \beta}$.
The total distance travelled is the area under the $v-t$ graph,which is a triangle with base $t$ and height $v _{0}$:
Distance $= \frac{1}{2} \times \text{base} \times \text{height} = \frac{1}{2} \times t \times v _{0}$
Substituting $v _{0}$:
Distance $= \frac{1}{2} \times t \times \left( \frac{\alpha \beta t}{\alpha + \beta} \right) = \frac{\alpha \beta t ^{2}}{2(\alpha + \beta)}$
0 likes
View Solution172
MediumMCQ
The velocity-displacement graph of a particle is shown in the figure. The acceleration-displacement graph of the same particle is represented by:
A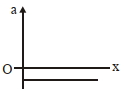
B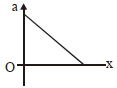
C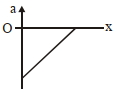
D
Solution
(C) From the given graph,the velocity $v$ as a function of displacement $x$ is a straight line with a negative slope.
Using the equation of a line $y = mx + c$,we have:
$v = -\left(\frac{v_{0}}{x_{0}}\right)x + v_{0}$
We know that acceleration $a$ is given by:
$a = v \frac{dv}{dx}$
First,find the derivative $\frac{dv}{dx}$:
$\frac{dv}{dx} = -\frac{v_{0}}{x_{0}}$
Now,substitute $v$ and $\frac{dv}{dx}$ into the expression for $a$:
$a = \left[-\left(\frac{v_{0}}{x_{0}}\right)x + v_{0}\right] \left[-\frac{v_{0}}{x_{0}}\right]$
$a = \left(\frac{v_{0}}{x_{0}}\right)^{2}x - \frac{v_{0}^{2}}{x_{0}}$
This equation represents a straight line with a positive slope $\left(\frac{v_{0}}{x_{0}}\right)^{2}$ and a negative intercept $-\frac{v_{0}^{2}}{x_{0}}$. Looking at the options,graph $C$ represents a linear relationship where $a$ increases with $x$ starting from a negative value,which matches our derived equation.
0 likes
View Solution173
MediumMCQ
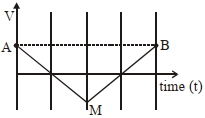
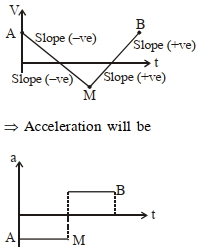
If the velocity-time graph has the shape $AMB$,what would be the shape of the corresponding acceleration-time graph?
A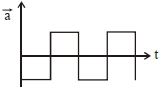
B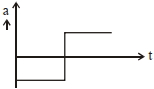
C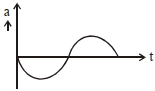
D
Solution
(B) The acceleration $a$ is defined as the slope of the velocity-time $(v-t)$ graph,i.e.,$a = \frac{dv}{dt}$.
In the given $v-t$ graph,the segment $AM$ represents a straight line with a constant negative slope. Therefore,the acceleration is constant and negative during this interval.
The segment $MB$ represents a straight line with a constant positive slope. Therefore,the acceleration is constant and positive during this interval.
Thus,the acceleration-time graph will show a constant negative value followed by a constant positive value,which matches the shape shown in option $B$.
0 likes
View Solution174
DifficultMCQ
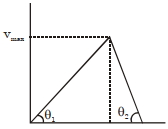
$A$ scooter accelerates from rest for time $t_{1}$ at a constant rate $a_{1}$ and then retards at a constant rate $a_{2}$ for time $t_{2}$ and comes to rest. The correct value of $\frac{t_{1}}{t_{2}}$ will be ..... .
A
$\frac{a_{1}+a_{2}}{a_{2}}$
B
$\frac{a_{2}}{a_{1}}$
C
$\frac{a_{1}}{a_{2}}$
D
$\frac{a_{1}+a_{2}}{a_{1}}$
Solution
(B) Let $v_{\max}$ be the maximum velocity attained by the scooter.
During the acceleration phase,the final velocity is $v_{\max} = 0 + a_{1}t_{1}$,so $t_{1} = \frac{v_{\max}}{a_{1}}$.
During the retardation phase,the final velocity is $0 = v_{\max} - a_{2}t_{2}$,so $t_{2} = \frac{v_{\max}}{a_{2}}$.
Taking the ratio of the two times:
$\frac{t_{1}}{t_{2}} = \frac{v_{\max} / a_{1}}{v_{\max} / a_{2}} = \frac{a_{2}}{a_{1}}$.
Alternatively,using the velocity-time graph,the slope of the acceleration part is $a_{1} = \tan \theta_{1} = \frac{v_{\max}}{t_{1}}$ and the magnitude of the slope of the retardation part is $a_{2} = \tan \theta_{2} = \frac{v_{\max}}{t_{2}}$.
Thus,$\frac{t_{1}}{t_{2}} = \frac{a_{2}}{a_{1}}$.
0 likes
View Solution175
AdvancedMCQ
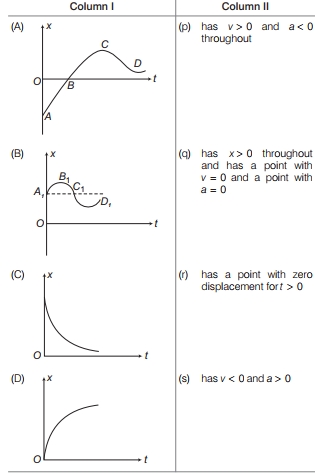
Refer to the graph in the figure. Match the following:
A
$(A \rightarrow r, B \rightarrow q, C \rightarrow s, D \rightarrow p)$
B
$(A \rightarrow q, B \rightarrow r, C \rightarrow s, D \rightarrow p)$
C
$(A \rightarrow r, B \rightarrow s, C \rightarrow q, D \rightarrow p)$
D
$(A \rightarrow r, B \rightarrow q, C \rightarrow p, D \rightarrow s)$
Solution
(A) To solve this,we analyze the slope of the position-time $(x-t)$ graph,which represents velocity $(v = dx/dt)$,and the curvature,which represents acceleration $(a = d^2x/dt^2)$.
$1$. Graph $(A)$: The curve crosses the $t$-axis at point $B$,where displacement $x = 0$. Thus,$(A) \rightarrow (r)$.
$2$. Graph $(B)$: The curve stays above the $t$-axis ($x > 0$ throughout). At the peak $B_1$,the slope is zero $(v = 0)$. There is a point of inflection between $B_1$ and $D_1$ where the curvature changes,implying $a = 0$. Thus,$(B) \rightarrow (q)$.
$3$. Graph $(C)$: The slope is always negative $(v < 0)$ and the curve is concave up $(a > 0)$. Thus,$(C) \rightarrow (s)$.
$4$. Graph $(D)$: The slope is always positive $(v > 0)$ and the curve is concave down $(a < 0)$. Thus,$(D) \rightarrow (p)$.
Therefore,the correct matching is $(A \rightarrow r, B \rightarrow q, C \rightarrow s, D \rightarrow p)$.
0 likes
View Solution176
MediumMCQ
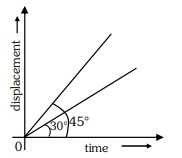
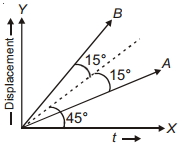
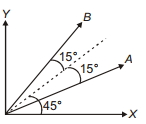
The displacement-time graphs of two moving particles make angles of $30^{\circ}$ and $45^{\circ}$ with the time-axis as shown in the figure. The ratio of their respective velocities is:
A
$1: 1$
B
$1: 2$
C
$1: \sqrt{3}$
D
$\sqrt{3}: 1$
Solution
(C) The velocity of a particle is given by the slope of the displacement-time graph.
$V = \frac{dx}{dt} = \tan \theta$
Given the angles $\theta_1 = 30^{\circ}$ and $\theta_2 = 45^{\circ}$,the ratio of their velocities is:
$\frac{V_1}{V_2} = \frac{\tan 30^{\circ}}{\tan 45^{\circ}}$
Since $\tan 30^{\circ} = \frac{1}{\sqrt{3}}$ and $\tan 45^{\circ} = 1$,we have:
$\frac{V_1}{V_2} = \frac{1/\sqrt{3}}{1} = \frac{1}{\sqrt{3}}$
Thus,the ratio is $1: \sqrt{3}$.
1 likes
View Solution177
DifficultMCQ
$A$ bullet is shot vertically downwards with an initial velocity of $100\,m/s$ from a certain height. Within $10\,s$,the bullet reaches the ground and instantaneously comes to rest due to a perfectly inelastic collision. The velocity-time curve for the total time $t = 20\,s$ will be: (Take $g = 10\,m/s^2$)
A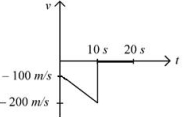
B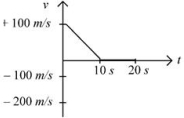
C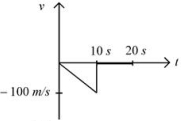
D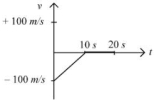
Solution
(A) The bullet is moving downwards. Let the downward direction be negative. The initial velocity is $u = -100\,m/s$.
The acceleration due to gravity is $g = 10\,m/s^2$ downwards,so $a = -10\,m/s^2$.
The velocity at any time $t$ (for $0 \le t \le 10\,s$) is given by $v = u + at = -100 - 10t$.
At $t = 0\,s$,$v = -100\,m/s$.
At $t = 10\,s$,$v = -100 - 10(10) = -200\,m/s$.
After $t = 10\,s$,the bullet hits the ground and comes to rest,so $v = 0$ for $10\,s < t \le 20\,s$.
The graph starts at $-100\,m/s$,decreases linearly to $-200\,m/s$ at $t = 10\,s$,and then stays at $0$ from $t = 10\,s$ to $t = 20\,s$. This corresponds to the graph in option $A$.
0 likes
View Solution178
MediumMCQ
If $t = \sqrt{x} + 4$,then $\left(\frac{dx}{dt}\right)_{t=4}$ is:
A
$4$
B
$0$
C
$8$
D
$16$
Solution
(B) Given the relation $t = \sqrt{x} + 4$.
First,isolate $\sqrt{x}$:
$\sqrt{x} = t - 4$
Squaring both sides:
$x = (t - 4)^2$
$x = t^2 - 8t + 16$
Now,differentiate $x$ with respect to $t$:
$\frac{dx}{dt} = \frac{d}{dt}(t^2 - 8t + 16)$
$\frac{dx}{dt} = 2t - 8$
Finally,evaluate the derivative at $t = 4$:
$\left(\frac{dx}{dt}\right)_{t=4} = 2(4) - 8$
$\left(\frac{dx}{dt}\right)_{t=4} = 8 - 8 = 0$
0 likes
View Solution179
MediumMCQ
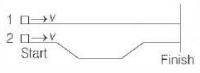
Two small blocks slide without losing contact with the surface along two frictionless tracks $1$ and $2$,starting at the same time with the same initial speed $v$. Track $1$ is perfectly horizontal,while track $2$ has a dip in the middle,as shown in the figure. Which block reaches the finish line first? [Hint: Use velocity-time graph to solve]
A
Block on track $1$ reaches the finish line first.
B
Block on track $2$ reaches the finish line first.
C
Both blocks reach the finish line at the same time.
D
It depends on the length of the dip in the second track relative to the total length of the tracks.
Solution
(B) The correct answer is $B$.
$1$. For block $1$,the velocity remains constant at $v$ throughout the motion because the track is horizontal and frictionless.
$2$. For block $2$,as it enters the dip,it gains potential energy which is converted into kinetic energy. Thus,its speed increases beyond $v$ while it is in the dip.
$3$. After passing the dip,the block returns to its original speed $v$ as it climbs back up to the horizontal level.
$4$. Since block $2$ travels a portion of the track with a speed greater than $v$,its average speed over the entire distance is greater than the constant speed $v$ of block $1$.
$5$. Consequently,block $2$ covers the same total horizontal distance in less time than block $1$.
0 likes
View Solution180
AdvancedMCQ
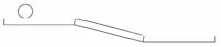
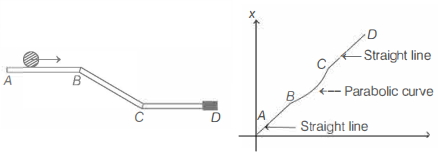
$A$ rigid ball rolls without slipping on a surface shown below: Which one of the following is the most likely representation of the distance travelled by the ball versus time graph?
A
B
C
D
Solution
(C) The motion of the ball can be divided into three parts:
$1$. From $A$ to $B$: The surface is horizontal,so the ball moves with a constant velocity. The distance-time graph is a straight line with a constant slope.
$2$. From $B$ to $C$: The surface is inclined,so the ball accelerates due to gravity. The velocity increases,and the distance-time graph is a parabolic curve with an increasing slope.
$3$. From $C$ to $D$: The surface is horizontal again,so the ball moves with a new constant velocity (higher than the initial velocity). The distance-time graph is a straight line with a higher constant slope than the $A B$ section.
Comparing this with the given options,option $C$ correctly represents this behavior,where the slope increases after the initial straight section and then remains constant at a higher value.
0 likes
View Solution181
AdvancedMCQ
An object at rest at the origin begins to move in the $+x$-direction with a uniform acceleration of $1 \, m/s^2$ for $4 \, s$ and then it continues moving with a uniform velocity of $4 \, m/s$ in the same direction. The $x-t$ graph for the object's motion will be:
A
B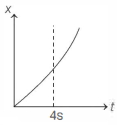
C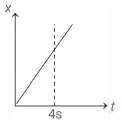
D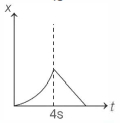
Solution
(B) For the first $4 \, s$,the object starts from rest $(u = 0)$ with uniform acceleration $a = 1 \, m/s^2$. The position $x$ as a function of time $t$ is given by $x = ut + \frac{1}{2}at^2 = 0 + \frac{1}{2}(1)t^2 = \frac{t^2}{2}$. This represents a parabolic curve opening upwards starting from the origin.
At $t = 4 \, s$,the velocity $v$ is $v = u + at = 0 + (1)(4) = 4 \, m/s$. The position at $t = 4 \, s$ is $x = \frac{(4)^2}{2} = 8 \, m$.
For $t > 4 \, s$,the object moves with a constant velocity of $4 \, m/s$. The position $x$ as a function of time $t$ is given by $x = x_0 + v(t - t_0) = 8 + 4(t - 4) = 8 + 4t - 16 = 4t - 8$. This represents a straight line with a constant positive slope of $4 \, m/s$.
The graph must show a parabolic curve for $0 \le t \le 4 \, s$ and a straight line for $t > 4 \, s$ with a continuous slope at $t = 4 \, s$. Option $(b)$ correctly depicts this behavior.
0 likes
View Solution182
DifficultMCQ
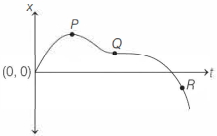
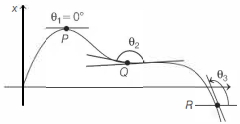
In the following displacement $x$ versus time $t$ graph,at which among the points $P, Q$ and $R$ is the object's speed increasing?
A
$R$ only
B
$P$ only
C
$Q$ and $R$ only
D
$P, Q$ and $R$
Solution
(A) In a displacement-time graph,the velocity at any point is given by the slope of the tangent to the curve at that point.
Speed is the magnitude of velocity,so the magnitude of the slope represents the speed.
At point $P$,the tangent is horizontal,so the slope is $0$,meaning the speed is $0$.
At point $Q$,the slope is small (the curve is relatively flat).
At point $R$,the tangent is very steep,meaning the magnitude of the slope $|m| = |\tan \theta|$ is the largest among the three points.
Since the speed is the magnitude of the slope,the speed is highest at point $R$. Therefore,the speed is increasing as we move towards point $R$ from the preceding region of the graph.
0 likes
View Solution183
AdvancedMCQ
The accompanying graph of position $x$ versus time $t$ represents the motion of a particle. If $p$ and $q$ are both positive constants,the expression that best describes the acceleration $a$ of the particle is
A
$a=-p-q t$
B
$a=-p+q t$
C
$a=p+q t$
D
$a=p-q t$
Solution
(D) The correct option is $(d)$.
$1$. The velocity $v$ of a particle is given by the slope of the position-time $(x-t)$ graph,i.e.,$v = \frac{dx}{dt}$.
$2$. Initially,the slope of the $x-t$ graph is negative and increasing (becoming less negative),then it becomes positive and increases,and finally,it becomes positive and decreases (approaching zero slope at the peak).
$3$. The acceleration $a$ is the rate of change of velocity,i.e.,$a = \frac{dv}{dt}$,which corresponds to the slope of the velocity-time $(v-t)$ graph.
$4$. From the given $x-t$ graph,the curvature changes from concave up to concave down. This implies that the acceleration is initially positive (as the velocity increases) and eventually becomes negative (as the velocity decreases).
$5$. Among the given options,the expression $a = p - qt$ (where $p, q > 0$) represents an acceleration that starts at a positive value $p$ and decreases linearly with time $t$,eventually becoming negative. This matches the physical behavior observed in the graph.
0 likes
View Solution184
EasyMCQ
An object is moving with variable speed,then
A
Its velocity may be zero
B
Its velocity must be variable
C
Its acceleration may be zero
D
Its velocity may be constant
Solution
(B) Speed is the magnitude of velocity. If the speed of an object is variable,it means the magnitude of its velocity is changing over time.
Since velocity is a vector quantity defined by both magnitude and direction,a change in the magnitude of velocity implies that the velocity vector itself must be changing.
Therefore,if the speed is variable,the velocity must also be variable.
Since velocity is a vector quantity defined by both magnitude and direction,a change in the magnitude of velocity implies that the velocity vector itself must be changing.
Therefore,if the speed is variable,the velocity must also be variable.
0 likes
View Solution185
MediumMCQ
The position of a particle moving along the $x$-axis is given by $x = 10t - 2t^2$. Then the time $(t)$ at which it will momentarily come to rest is .......... $s$.
A
$0$
B
$2.5$
C
$5$
D
$10$
Solution
(B) The position of the particle is given by $x = 10t - 2t^2$.
To find the velocity $(v)$,we differentiate the position with respect to time $(t)$:
$v = \frac{dx}{dt} = \frac{d}{dt}(10t - 2t^2) = 10 - 4t$.
For the particle to momentarily come to rest,its velocity must be zero:
$v = 0$.
Substituting the expression for velocity:
$10 - 4t = 0$.
$4t = 10$.
$t = \frac{10}{4} = 2.5 \, s$.
Thus,the particle comes to rest at $t = 2.5 \, s$.
0 likes
View Solution186
EasyMCQ
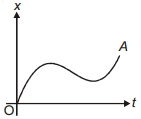
The position-time graph for a body moving along a straight line between $O$ and $A$ is shown in the figure. During its motion between $O$ and $A$,how many times does the body come to rest?
A
$0$
B
$1$ time
C
$2$ times
D
$3$ times
Solution
(C) The velocity of a body is given by the slope of the position-time graph,which is $v = \frac{dx}{dt}$.
$A$ body comes to rest when its velocity is zero,which means the slope of the position-time graph must be zero.
In the given graph,the slope is zero at the points where the curve has a local maximum and a local minimum.
Since there is one local maximum and one local minimum between $O$ and $A$,the slope is zero at these two points.
Therefore,the body comes to rest $2$ times.
0 likes
View Solution187
EasyMCQ
Which one of the following graphs for a body moving along a straight line is possible?
A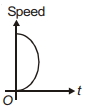
B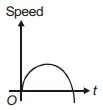
C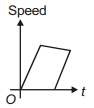
D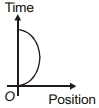
Solution
(A) The correct answer is $A$.
In a speed-time graph,speed is a scalar quantity and must always be non-negative.
Graph $A$ shows speed decreasing to zero and then increasing again,which is physically possible for a body moving in a straight line.
Graph $B$ shows speed becoming negative,which is impossible as speed cannot be negative.
Graph $C$ shows that at a single instant of time,the body has two different speeds,which is impossible.
Graph $D$ is a position-time graph where at a single position,the body exists at multiple times,which is possible,but the question asks for a graph of a body moving along a straight line where the speed-time relationship is typically represented. However,looking at the options provided,$A$ represents a valid speed-time graph where speed is always $\ge 0$.
0 likes
View Solution188
MediumMCQ
The displacement-time graph for two particles $A$ and $B$ is as follows. The ratio $\frac{v_A}{v_B}$ is
A
$1: 2$
B
$1: \sqrt{3}$
C
$\sqrt{3}: 1$
D
$1: 3$
Solution
(D) The velocity of a particle in a displacement-time graph is given by the slope of the line,which is $\tan \theta$,where $\theta$ is the angle the line makes with the time axis ($X$-axis).
From the given graph:
For particle $A$,the angle with the $X$-axis is $\theta_A = 45^{\circ} - 15^{\circ} = 30^{\circ}$.
Thus,the velocity of $A$ is $v_A = \tan 30^{\circ} = \frac{1}{\sqrt{3}}$.
For particle $B$,the angle with the $X$-axis is $\theta_B = 45^{\circ} + 15^{\circ} = 60^{\circ}$.
Thus,the velocity of $B$ is $v_B = \tan 60^{\circ} = \sqrt{3}$.
The ratio $\frac{v_A}{v_B}$ is calculated as:
$\frac{v_A}{v_B} = \frac{\tan 30^{\circ}}{\tan 60^{\circ}} = \frac{1/\sqrt{3}}{\sqrt{3}} = \frac{1}{3}$.
Therefore,the ratio $v_A : v_B$ is $1: 3$.
0 likes
View Solution189
MediumMCQ
The figure shows the graph of the $x$-coordinate of a particle moving along the $x$-axis as a function of time. The average velocity during $t=0$ to $6 \,s$ and the instantaneous velocity at $t=3 \,s$ respectively,will be
A
$10 \,m/s, 0$
B
$60 \,m/s, 0$
C
$0, 0$
D
$0, 10 \,m/s$
Solution
(C) $1$. Average velocity is defined as the total displacement divided by the total time interval: $v_{avg} = \frac{\Delta x}{\Delta t}$.
$2$. From the graph,at $t=0 \,s$,$x=0 \,m$. At $t=6 \,s$,$x=0 \,m$.
$3$. Total displacement $\Delta x = x(6) - x(0) = 0 - 0 = 0 \,m$.
$4$. Therefore,average velocity $v_{avg} = \frac{0}{6} = 0 \,m/s$.
$5$. Instantaneous velocity is the slope of the $x-t$ graph at a given time: $v = \frac{dx}{dt}$.
$6$. At $t=3 \,s$,the particle is in the interval $t=1 \,s$ to $t=4 \,s$,where the position $x$ is constant at $10 \,m$.
$7$. Since the position is constant,the slope of the graph is zero. Thus,the instantaneous velocity at $t=3 \,s$ is $0 \,m/s$.
0 likes
View Solution190
EasyMCQ
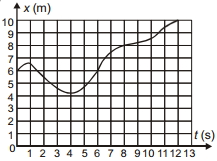
The position-time graph for a particle is shown in the figure. Starting from $t=0$,at what time $t$ (in seconds) is the average velocity zero?
A
$1$
B
$3$
C
$6$
D
$7$
Solution
(C) The average velocity $v_{av}$ is defined as the total displacement divided by the total time interval: $v_{av} = \frac{\Delta x}{\Delta t} = \frac{x_f - x_i}{t_f - t_i}$.
For the average velocity to be zero,the total displacement must be zero,which means the final position $x_f$ must be equal to the initial position $x_i$.
From the graph,at $t_i = 0 \, s$,the initial position is $x_i = 6 \, m$.
We need to find the time $t$ such that the position $x(t) = 6 \, m$.
Looking at the graph,the curve intersects the line $x = 6 \, m$ at $t = 0 \, s$ and again at $t = 6 \, s$.
Therefore,at $t = 6 \, s$,the displacement is $\Delta x = 6 \, m - 6 \, m = 0 \, m$.
Thus,the average velocity is zero at $t = 6 \, s$.
0 likes
View Solution191
MediumMCQ
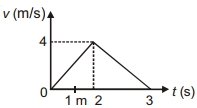
The velocity versus time graph of a body moving in a straight line is as shown in the figure below.

A
The distance covered by the body in $0$ to $2 \,s$ is $8 \,m$.
B
The acceleration of the body in $0$ to $2 \,s$ is $4 \,ms^{-2}$.
C
The acceleration of the body in $2$ to $3 \,s$ is $4 \,ms^{-2}$.
D
The distance moved by the body during $0$ to $3 \,s$ is $6 \,m$.
Solution
(D) The distance covered by the body is equal to the area under the velocity-time $(v-t)$ graph.
For the interval $t = 0 \,s$ to $t = 3 \,s$, the area is a triangle with base $b = 3 \,s$ and height $h = 4 \,m/s$.
Distance $= \text{Area} = \frac{1}{2} \times \text{base} \times \text{height} = \frac{1}{2} \times 3 \times 4 = 6 \,m$.
Thus, option $(D)$ is correct.
For the interval $t = 0 \,s$ to $t = 2 \,s$, the distance is $\frac{1}{2} \times 2 \times 4 = 4 \,m$.
The acceleration in the interval $t = 0 \,s$ to $t = 2 \,s$ is the slope of the graph: $a = \frac{4-0}{2-0} = 2 \,ms^{-2}$.
The acceleration in the interval $t = 2 \,s$ to $t = 3 \,s$ is the slope of the graph: $a = \frac{0-4}{3-2} = -4 \,ms^{-2}$.
0 likes
View Solution192
MediumMCQ
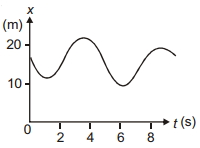
The figure shows the position of a particle moving on the $x$-axis as a function of time.
A
The particle has come to rest $4$ times.
B
The velocity at $t=8 \, s$ is negative.
C
The velocity remains positive for $t=2 \, s$ to $t=6 \, s$.
D
The particle moves with a constant velocity.
Solution
(A) The velocity of the particle is given by the slope of the position-time graph,$v = \frac{dx}{dt}$.
$1$. The particle comes to rest when the velocity is zero,which corresponds to the points where the slope of the $x-t$ graph is zero (the peaks and troughs of the curve).
$2$. Looking at the graph,there are peaks at approximately $t \approx 3.5 \, s$ and $t \approx 8.5 \, s$,and troughs at approximately $t \approx 1 \, s$ and $t \approx 6 \, s$. Thus,the particle comes to rest at $4$ distinct points.
$3$. At $t=8 \, s$,the graph is sloping upwards,meaning the velocity is positive.
$4$. Between $t=2 \, s$ and $t=6 \, s$,the graph goes from a peak to a trough,meaning the slope is negative (velocity is negative).
$5$. Since the slope is changing,the velocity is not constant.
Therefore,the correct statement is that the particle has come to rest $4$ times.
0 likes
View Solution193
MediumMCQ
$A$ particle moves along the $x$-axis in such a way that its $x$-coordinate varies with time according to the equation $x = 4 - 2t + t^2$. The velocity of the particle will vary with time as:
A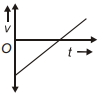
B
C
D
Solution
(A) The position of the particle is given by $x = 4 - 2t + t^2$.
The velocity $v$ is the time derivative of the position $x$:
$v = \frac{dx}{dt} = \frac{d}{dt}(4 - 2t + t^2)$
$v = -2 + 2t$
This equation $v = 2t - 2$ represents a straight line with a positive slope $(2)$ and a negative $y$-intercept $(-2)$.
As $t$ increases,$v$ increases linearly from $-2$ at $t = 0$ to $0$ at $t = 1$,and becomes positive for $t > 1$.
This corresponds to the graph shown in option $A$.
0 likes
View Solution194
MediumMCQ
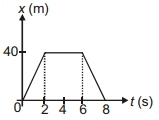
The position $(x)$ of a particle moving along the $x$-axis varies with time $(t)$ as shown in the figure. The average acceleration of the particle in the time interval $t=0$ to $t=8 \, s$ is ........... $m/s^2$.
A
$-5$
B
$3$
C
$-4$
D
$2.5$
Solution
(A) The average acceleration is defined as the change in velocity divided by the time interval: $a_{\text{avg}} = \frac{\Delta v}{\Delta t}$.
From the position-time graph:
For the interval $t=0$ to $t=2 \, s$,the velocity $v_1 = \frac{40 - 0}{2 - 0} = 20 \, m/s$.
For the interval $t=6$ to $t=8 \, s$,the velocity $v_2 = \frac{0 - 40}{8 - 6} = -20 \, m/s$.
The change in velocity $\Delta v = v_2 - v_1 = -20 - 20 = -40 \, m/s$.
The total time interval $\Delta t = 8 - 0 = 8 \, s$.
Therefore,$a_{\text{avg}} = \frac{-40}{8} = -5 \, m/s^2$.
0 likes
View Solution195
MediumMCQ
The velocity $v$ of a body moving along a straight line varies with time $t$ as $v = 2 t^2 e^{-t}$,where $v$ is in $m/s$ and $t$ is in $s$. The acceleration of the body is zero at $t =$
A
$0 \ s$
B
$2 \ s$
C
$3 \ s$
D
Both $(a)$ and $(b)$
Solution
(D) The velocity is given by $v = 2 t^2 e^{-t}$.
Acceleration $a$ is the rate of change of velocity with respect to time,$a = \frac{dv}{dt}$.
Using the product rule for differentiation: $a = 2 \left[ t^2 \frac{d}{dt}(e^{-t}) + e^{-t} \frac{d}{dt}(t^2) \right]$.
$a = 2 [ t^2 (-e^{-t}) + e^{-t} (2t) ]$.
$a = 2 e^{-t} (2t - t^2)$.
For acceleration to be zero,set $a = 0$:
$2 e^{-t} (2t - t^2) = 0$.
Since $2 e^{-t}$ is never zero for any finite $t$,we must have $2t - t^2 = 0$.
$t(2 - t) = 0$.
This gives $t = 0 \ s$ or $t = 2 \ s$.
Thus,the acceleration is zero at $t = 0 \ s$ and $t = 2 \ s$.
0 likes
View Solution196
DifficultMCQ
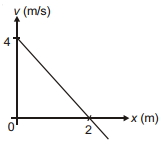
The velocity $(v)$ of a particle moving along the $x$-axis varies with its position $(x)$ as shown in the figure. How does the acceleration $(a)$ of the particle vary with position $(x)$?
A
$a^2 = x + 3$
B
$a = 2x^2 + 4$
C
$2a = 3x + 5$
D
$a = 4x - 8$
Solution
(D) The acceleration $a$ is given by the formula $a = v \frac{dv}{dx}$.
First,we find the equation of the line representing velocity $v$ as a function of position $x$. The line passes through the points $(0, 4)$ and $(2, 0)$.
The slope $m$ of the line is given by $m = \frac{v_2 - v_1}{x_2 - x_1} = \frac{0 - 4}{2 - 0} = \frac{-4}{2} = -2$.
The $y$-intercept $c$ is $4$.
Thus,the equation of the line is $v = mx + c$,which gives $v = -2x + 4$.
Now,we differentiate $v$ with respect to $x$ to find $\frac{dv}{dx}$:
$\frac{dv}{dx} = \frac{d}{dx}(-2x + 4) = -2$.
Finally,we substitute $v$ and $\frac{dv}{dx}$ into the acceleration formula:
$a = v \frac{dv}{dx} = (-2x + 4)(-2) = 4x - 8$.
Therefore,the correct option is $(d)$.
0 likes
View Solution197
MediumMCQ
The velocity $(v)$-time $(t)$ graph for a particle moving along the $x$-axis is shown in the figure. The corresponding position $(x)$-time $(t)$ graph is best represented by:
A
B
C
D
Solution
(A) The velocity $(v)$ is the slope of the position $(x)$-time $(t)$ graph,i.e.,$v = \frac{dx}{dt}$.
In the first interval,the velocity increases linearly from $0$ to a maximum value. Since $v = at$ (where $a$ is constant acceleration),the position $x = \int v dt = \frac{1}{2}at^2$,which is a parabola opening upwards.
In the second interval,the velocity is negative and its magnitude decreases linearly to $0$. This implies a negative acceleration (deceleration). The position $x$ will follow a parabolic path that returns to the initial position (or a specific point) with a decreasing slope.
The correct graph shows a parabolic increase in position followed by a parabolic decrease,which matches the shape where the slope of the $x-t$ graph corresponds to the given $v-t$ graph.
0 likes
View Solution198
MediumMCQ
Which of the following speed-time $(v-t)$ graphs is physically not possible?
A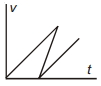
B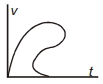
C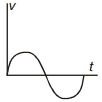
D
All of these
Solution
(D) In a physically possible speed-time $(v-t)$ graph,for any given instant of time $t$,there must be a unique value of speed $v$.
$1$. In graph $A$,at a certain time $t$,there are two different values of speed $v$,which is impossible.
$2$. In graph $B$,for a single time $t$,there are multiple values of speed $v$ due to the curve folding back on itself,which is impossible.
$3$. In graph $C$,the speed $v$ becomes negative. By definition,speed is a scalar quantity and is always non-negative $(v \ge 0)$. Therefore,a graph showing negative speed is physically impossible.
Since all three graphs violate the fundamental definitions of speed and time,all of them are physically impossible.
0 likes
View Solution199
EasyMCQ
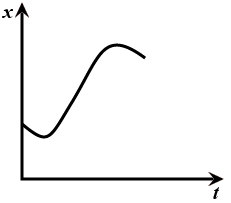
The displacement $(x)$ - time $(t)$ graph of a particle is shown in the figure. Which of the following is correct?
A
Particle starts with zero velocity and variable acceleration
B
Particle starts with non-zero velocity and variable acceleration
C
Particle starts with zero velocity and uniform acceleration
D
Particle starts with non-zero velocity and uniform acceleration
Solution
(A) The slope of the displacement-time graph represents the velocity of the particle,i.e.,$v = \frac{dx}{dt}$.
At $t = 0$,the graph starts from the origin $(0, 0)$ and the tangent to the curve at the origin is horizontal (parallel to the $t$-axis).
Since the slope of the tangent at $t = 0$ is zero,the initial velocity of the particle is zero.
As time increases,the slope of the curve changes continuously,which implies that the velocity is changing with time.
Since the velocity is changing with time,the particle is undergoing acceleration.
Because the slope (velocity) is not changing at a constant rate (the curvature of the graph is not parabolic),the acceleration is variable.
Therefore,the particle starts with zero velocity and variable acceleration.
0 likes
View Solution200
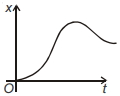
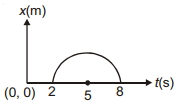
MediumMCQ
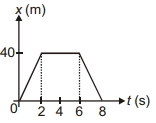
The position-time graph of a particle moving along a straight line is shown,which is in the form of a semicircle starting from $t=2 \, s$ to $t=8 \, s$. Select the correct statement.
A
Velocity of the particle between $t=0 \, s$ to $t=2 \, s$ is positive.
B
Velocity of the particle is opposite to acceleration between $t=2 \, s$ to $t=5 \, s$.
C
Velocity of the particle is opposite to acceleration between $t=5 \, s$ to $t=8 \, s$.
D
Acceleration of the particle is positive between $t=2 \, s$ to $t=5 \, s$ while it is negative between $t=5 \, s$ to $t=8 \, s$.
Solution
(B) The correct option is $(B)$.
$(i)$ From $t=0 \, s$ to $t=2 \, s$,the position $x=0$,so the velocity $v = \frac{dx}{dt} = 0$.
$(ii)$ From $t=2 \, s$ to $t=5 \, s$,the slope of the $x-t$ graph is positive (velocity $v > 0$),but the graph is concave downwards,which implies acceleration $a < 0$. Since $v$ and $a$ have opposite signs,the velocity is opposite to the acceleration.
$(iii)$ From $t=5 \, s$ to $t=8 \, s$,the slope of the $x-t$ graph is negative (velocity $v < 0$),and the graph is concave downwards (acceleration $a < 0$). Since both $v$ and $a$ are negative,they are in the same direction.
0 likes
View SolutionMotion in Straight Line — Instantaneous Velocity and Speed and Velocity-time Graph · Frequently Asked Questions
1Are these Motion in Straight Line questions useful for JEE and NEET?
Yes. All questions in this section are mapped to JEE Main and NEET exam patterns. Previous year questions from JEE Main, NEET, GUJCET and state-level exams are included with full solutions.
2Can I switch to Hindi or Gujarati for these questions?
Yes. Use the language tabs in the hero section or the sidebar to view the same questions and solutions in English, Hindi or Gujarati.
3How do I generate a question paper from this subtopic?
Use the Vedclass Exam Paper Generator — select the chapter and subtopic, set difficulty, and generate Sets A, B, C, D automatically. First 3 chapters of every subject are free.
Vedclass Products
For Students
Vedclass Test Series
Mock tests in real JEE/NEET style with performance analysis. 5-day free trial.
Start Free TrialFor Teachers
Exam Paper Generator
Generate Set A/B/C/D papers from this chapter in 2 minutes. 3 chapters free.
Try FreeFor Institutes
Online Exam Module
Live online exams with unlimited students, 360° analytics & white-label branding.
See DemoFor Teachers & Institutes
Generate a Motion in Straight Line Exam Paper in 2 Minutes
Select subtopic & difficulty — Sets A, B, C, D auto-generated with No Repeat logic.
First 3 chapters of every subject are free — no payment required.