
Medium
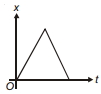
The velocity $(v)$-time $(t)$ graph for a particle moving along the $x$-axis is shown in the figure. The corresponding position $(x)$-time $(t)$ graph is best represented by:
- A

- B
- C
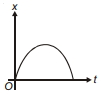
- D

Explore More
Similar Questions
What does $\dot x$ represent?
Medium
View Solution$A$ rigid ball rolls without slipping on a surface shown below: Which one of the following is the most likely representation of the distance travelled by the ball versus time graph?
$A$ velocity-time graph of a body is shown below. The distance covered by the body from $t = 6 \ s$ to $t = 9 \ s$ is: (in $m$)
The acceleration-time graph for a particle is given. What will be the corresponding velocity-time graph?
Difficult
View SolutionThe velocity $v$ of a body moving along a straight line varies with time $t$ as $v = 2 t^2 e^{-t}$,where $v$ is in $m/s$ and $t$ is in $s$. The acceleration of the body is zero at $t =$
Medium
View SolutionVedclass Products
For Students
Vedclass Test Series
Mock tests in real JEE/NEET style with performance analysis. 5-day free trial.
Start Free TrialFor Teachers
Exam Paper Generator
Generate Set A/B/C/D exam papers from 7.5L+ questions in 2 minutes. 3 chapters free.
Try FreeFor Institutes
Online Exam Module
Live online exams with unlimited students, 360° analytics & white-label branding.
See Demo