
Difficult
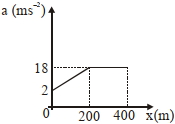
The velocity-displacement graph describing the motion of a bicycle is shown in the figure. The acceleration-displacement graph of the bicycle's motion is best described by:
- A
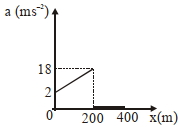
- B
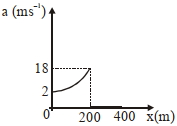
- C
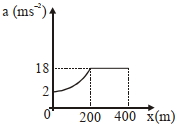
- D
Explore More
Similar Questions
The position-time graph for a particle is shown in the figure. Starting from $t=0$,at what time $t$ (in seconds) is the average velocity zero?
Easy
View SolutionThe acceleration-time graph of a body is shown below. The most probable velocity-time graph of the body is:
Difficult
View Solution$A$ body moves with velocity $v = \ln x \, m/s$ where $x$ is its position. The net force acting on the body is zero at
Difficult
View SolutionConsider a car initially at rest,starts to move along a straight road first with acceleration $5 \ m \ s^{-2}$,then with uniform velocity and finally,decelerating at $5 \ m \ s^{-2}$,before coming to a stop. Total time taken from start to end is $t = 25 \ s$. If the average velocity during that time is $72 \ km \ hr^{-1}$,the car moved with uniform velocity for a time of: (in $s$)
Match Column-$I$ with Column-$II$ based on the distance-time $(d-t)$ graphs provided in the image.
$(1)$ Velocity decreases $(a)$ Linear graph (constant slope) $(2)$ Velocity increases $(b)$ Concave up graph (increasing slope) $(3)$ Velocity is constant $(c)$ Concave down graph (decreasing slope)
| $(1)$ Velocity decreases | $(a)$ Linear graph (constant slope) |
| $(2)$ Velocity increases | $(b)$ Concave up graph (increasing slope) |
| $(3)$ Velocity is constant | $(c)$ Concave down graph (decreasing slope) |
Easy
View SolutionVedclass Products
For Students
Vedclass Test Series
Mock tests in real JEE/NEET style with performance analysis. 5-day free trial.
Start Free TrialFor Teachers
Exam Paper Generator
Generate Set A/B/C/D exam papers from 7.5L+ questions in 2 minutes. 3 chapters free.
Try FreeFor Institutes
Online Exam Module
Live online exams with unlimited students, 360° analytics & white-label branding.
See Demo