
A English
Instantaneous Velocity and Speed and Velocity-time Graph Questions in English
Class 11 Physics · Motion in Straight Line · Instantaneous Velocity and Speed and Velocity-time Graph
244+
Questions
English
Language
100%
With Solutions
Showing 44 of 244 questions in English
201
MediumMCQ
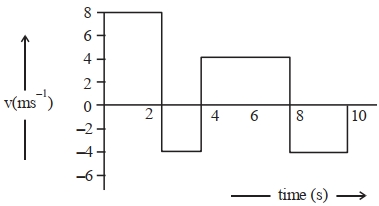
The velocity-time graph of a body moving in a straight line is shown in the figure. The ratio of displacement to distance travelled by the body in time $0$ to $10\,s$ is
A
$1: 1$
B
$1: 4$
C
$1: 2$
D
$1: 3$
Solution
(D) The displacement is the algebraic sum of the areas under the velocity-time graph.
Area $1$ ($0$ to $2\,s$): $2 \times 8 = 16\,m$
Area $2$ ($2$ to $4\,s$): $2 \times (-4) = -8\,m$
Area $3$ ($4$ to $8\,s$): $4 \times 4 = 16\,m$
Area $4$ ($8$ to $10\,s$): $2 \times (-4) = -8\,m$
Displacement $= 16 - 8 + 16 - 8 = 16\,m$
Distance is the sum of the magnitudes of the areas.
Distance $= |16| + |-8| + |16| + |-8| = 16 + 8 + 16 + 8 = 48\,m$
Ratio of displacement to distance $= \frac{16}{48} = \frac{1}{3}$ or $1: 3$.
0 likes
View Solution202
EasyMCQ
The distance travelled by a particle is related to time $t$ as $x = 4t^2$. The velocity of the particle at $t = 5 \, s$ is $......... \, ms^{-1}$.
A
$40$
B
$25$
C
$20$
D
$8$
Solution
(A) The position of the particle is given by $x = 4t^2$.
To find the velocity $v$,we differentiate the position $x$ with respect to time $t$:
$v = \frac{dx}{dt} = \frac{d}{dt}(4t^2) = 8t$.
Now,substitute the given time $t = 5 \, s$ into the velocity equation:
$v = 8 \times 5 = 40 \, ms^{-1}$.
Therefore,the velocity of the particle at $t = 5 \, s$ is $40 \, ms^{-1}$.
0 likes
View Solution203
MediumMCQ
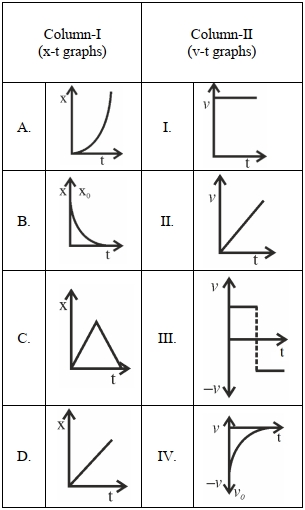
Match Column-$I$ with Column-$II$:
A
$(A)-(II), (B)-(IV), (C)-(III), (D)-(I)$
B
$(A)-(I), (B)-(II), (C)-(III), (D)-(IV)$
C
$(A)-(II), (B)-(III), (C)-(IV), (D)-(I)$
D
$(A)-(I), (B)-(III), (C)-(IV), (D)-(II)$
Solution
(A) The velocity $v$ is given by the slope of the $x-t$ graph,i.e.,$v = \frac{dx}{dt}$.
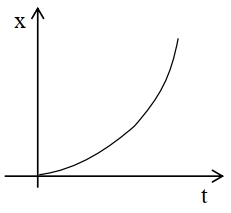
$(A)$ The $x-t$ graph is a parabola opening upwards,indicating increasing slope. Thus,$v$ increases with time. This matches graph $II$.
$(B)$ The $x-t$ graph shows a decreasing position with a decreasing slope (magnitude),approaching zero. This corresponds to a negative velocity whose magnitude decreases towards zero. This matches graph $IV$.
$(C)$ The $x-t$ graph shows a constant positive slope followed by a constant negative slope. This corresponds to a positive constant velocity followed by a negative constant velocity. This matches graph $III$.
$(D)$ The $x-t$ graph is a straight line with a constant positive slope,indicating constant positive velocity. This matches graph $I$.
Therefore,the correct matching is $(A)-(II), (B)-(IV), (C)-(III), (D)-(I)$.
0 likes
View Solution204
EasyMCQ
The position-time $(x-t)$ graph for positive acceleration is
A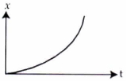
B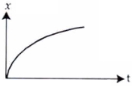
C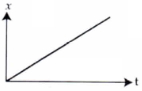
D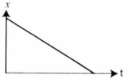
Solution
(A) For an object moving with constant positive acceleration $(a > 0)$,the position-time equation is given by the kinematic equation: $x(t) = x_0 + v_0 t + \frac{1}{2} a t^2$.
If we assume the initial position $x_0 = 0$ and initial velocity $v_0 = 0$,the equation simplifies to $x = \frac{1}{2} a t^2$.
This equation represents a parabola opening upwards in the $x-t$ plane.
As $t$ increases,the slope of the tangent to the curve (which represents velocity $v = \frac{dx}{dt} = at$) also increases,indicating that the velocity is increasing over time,which is the definition of positive acceleration.
Therefore,the graph shown in option $A$ represents motion with positive acceleration.
0 likes
View Solution205
MediumMCQ
Given below are two statements:
Statement $I:$ Area under velocity-time graph gives the displacement of the body in a given time.
Statement $II:$ Area under acceleration-time graph is equal to the change in velocity in the given time.
In the light of given statements,choose the correct answer from the options given below.
Statement $I:$ Area under velocity-time graph gives the displacement of the body in a given time.
Statement $II:$ Area under acceleration-time graph is equal to the change in velocity in the given time.
In the light of given statements,choose the correct answer from the options given below.
A
Both Statement $I$ and Statement $II$ are true.
B
Statement $I$ is true but Statement $II$ is false.
C
Statement $I$ is false but Statement $II$ is true.
D
Both Statement $I$ and Statement $II$ are false.
Solution
(C) The area under a velocity-time graph represents the displacement of the body,not necessarily the distance (distance is the area under the speed-time graph). Therefore,Statement $I$ is technically false because it specifies 'distance' instead of 'displacement'.
The area under an acceleration-time graph is given by $\int a \, dt = \int \frac{dv}{dt} \, dt = \Delta v$. This represents the change in velocity. Therefore,Statement $II$ is true.
Thus,Statement $I$ is false and Statement $II$ is true.
The area under an acceleration-time graph is given by $\int a \, dt = \int \frac{dv}{dt} \, dt = \Delta v$. This represents the change in velocity. Therefore,Statement $II$ is true.
Thus,Statement $I$ is false and Statement $II$ is true.
0 likes
View Solution206
MediumMCQ
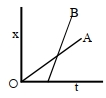
The position-time graphs for two students $A$ and $B$ returning from the school to their homes are shown in the figure.
$(A)$ $A$ lives closer to the school.
$(B)$ $B$ lives closer to the school.
$(C)$ $A$ takes less time to reach home.
$(D)$ $A$ travels faster than $B$.
$(E)$ $B$ travels faster than $A$.
Choose the correct answer from the options given below:
$(A)$ $A$ lives closer to the school.
$(B)$ $B$ lives closer to the school.
$(C)$ $A$ takes less time to reach home.
$(D)$ $A$ travels faster than $B$.
$(E)$ $B$ travels faster than $A$.
Choose the correct answer from the options given below:
A
$(A)$ and $(E)$ only
B
$(B)$ and $(E)$ only
C
$(A), (C)$ and $(E)$ only
D
$(A), (C)$ and $(D)$ only
Solution
(A) $1$. The position-time graph shows the distance from the school on the $x$-axis and time on the $t$-axis. The school is at the origin $(x=0)$.
$2$. The point where the graph intersects the $t$-axis represents the time when the student starts their journey. Since $B$ starts later than $A$,and the graph for $A$ reaches the $x$-axis intercept (home) at a lower $x$ value compared to $B$ at the same time,we analyze the intercepts.
$3$. Looking at the graph,the $x$-intercept for $A$ is lower than the $x$-intercept for $B$. Thus,$A$ lives closer to the school. Statement $(A)$ is correct.
$4$. The slope of the position-time graph represents velocity $(v = dx/dt)$. Since the slope of line $B$ is greater than the slope of line $A$,$B$ travels faster than $A$. Statement $(E)$ is correct.
$5$. Therefore,statements $(A)$ and $(E)$ are correct.
0 likes
View Solution207
MediumMCQ
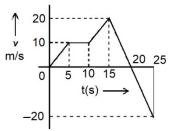
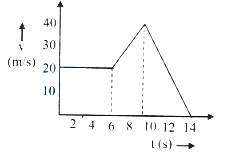
From the given $v-t$ graph,find the ratio of distance to displacement in $25\,s$ of motion.
A
$\frac{3}{5}$
B
$\frac{1}{2}$
C
$\frac{5}{3}$
D
$1$
Solution
(C) The distance is the total area under the $v-t$ graph (taking all areas as positive),and displacement is the net area (taking areas below the time axis as negative).
$1$. Area from $t=0$ to $t=5\,s$ (triangle): $\frac{1}{2} \times 5 \times 10 = 25\,m$.
$2$. Area from $t=5$ to $t=10\,s$ (rectangle): $5 \times 10 = 50\,m$.
$3$. Area from $t=10$ to $t=15\,s$ (trapezium): $\frac{1}{2} \times (10 + 20) \times 5 = 75\,m$.
$4$. Area from $t=15$ to $t=20\,s$ (triangle): $\frac{1}{2} \times 5 \times 20 = 50\,m$.
$5$. Area from $t=20$ to $t=25\,s$ (triangle below axis): $\frac{1}{2} \times 5 \times (-20) = -50\,m$.
Total distance $= 25 + 50 + 75 + 50 + |-50| = 250\,m$.
Total displacement $= 25 + 50 + 75 + 50 - 50 = 150\,m$.
Ratio of distance to displacement $= \frac{250}{150} = \frac{5}{3}$.
0 likes
View Solution208
EasyMCQ
The distance travelled by an object in time $t$ is given by $s = 2.5 t^2$. The instantaneous speed of the object at $t = 5\,s$ will be $....\,m/s$.
A
$12.5$
B
$62.5$
C
$5$
D
$25$
Solution
(D) The distance $s$ is given as a function of time $t$ by the equation $s = 2.5 t^2$.
The instantaneous speed $v$ is defined as the time derivative of the distance $s$,given by $v = \frac{ds}{dt}$.
Substituting the expression for $s$: $v = \frac{d}{dt}(2.5 t^2)$.
Using the power rule for differentiation,$\frac{d}{dt}(t^n) = n t^{n-1}$,we get $v = 2.5 \times 2 \times t = 5t$.
To find the instantaneous speed at $t = 5\,s$,substitute $t = 5$ into the expression for $v$:
$v = 5 \times 5 = 25\,m/s$.
0 likes
View Solution209
EasyMCQ
The position of a particle related to time is given by $x = (5t^2 - 4t + 5) \, m$. The magnitude of velocity of the particle at $t = 2 \, s$ will be $........... \, ms^{-1}$.
A
$10$
B
$14$
C
$16$
D
$06$
Solution
(C) The position of the particle is given by the equation $x = 5t^2 - 4t + 5$.
To find the velocity $v$,we differentiate the position $x$ with respect to time $t$:
$v = \frac{dx}{dt} = \frac{d}{dt}(5t^2 - 4t + 5)$.
Applying the power rule,we get $v = 10t - 4$.
Now,substitute $t = 2 \, s$ into the velocity equation:
$v = 10(2) - 4 = 20 - 4 = 16 \, ms^{-1}$.
Therefore,the magnitude of the velocity at $t = 2 \, s$ is $16 \, ms^{-1}$.
0 likes
View Solution210
MediumMCQ
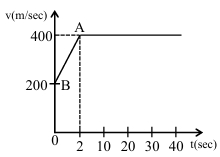
The motion of an airplane is represented by a velocity-time graph as shown below. The distance covered by the airplane in the first $30.5 \ s$ is . . . . . . $km$.
A
$9$
B
$6$
C
$3$
D
$12$
Solution
(D) The distance covered is equal to the area under the velocity-time graph.
For $t = 0$ to $t = 2 \ s$,the graph is a trapezoid with parallel sides $200 \ m/s$ and $400 \ m/s$,and height $2 \ s$.
Area $1 = \frac{1}{2} \times (200 + 400) \times 2 = 600 \ m$.
For $t = 2 \ s$ to $t = 30.5 \ s$,the velocity is constant at $400 \ m/s$.
Time interval $\Delta t = 30.5 - 2 = 28.5 \ s$.
Area $2 = 400 \times 28.5 = 11400 \ m$.
Total distance $= 600 + 11400 = 12000 \ m$.
Converting to kilometers: $12000 \ m = 12 \ km$.
0 likes
View Solution211
MediumMCQ
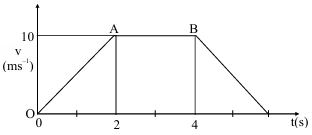
The velocity-time graph of an object moving along a straight line is shown in the figure. What is the distance (in $m$) covered by the object between $t = 0$ and $t = 4 \; s$?
A
$30$
B
$10$
C
$13$
D
$11$
Solution
(A) The distance covered by an object is equal to the area under the velocity-time graph.
To find the distance between $t = 0 \; s$ and $t = 4 \; s$,we calculate the area of the region under the graph from $t = 0$ to $t = 4$.
This region consists of a triangle from $t = 0$ to $t = 2$ and a rectangle from $t = 2$ to $t = 4$.
Area of triangle (from $t = 0$ to $t = 2$) $= \frac{1}{2} \times \text{base} \times \text{height} = \frac{1}{2} \times 2 \; s \times 10 \; m/s = 10 \; m$.
Area of rectangle (from $t = 2$ to $t = 4$) $= \text{length} \times \text{width} = (4 - 2) \; s \times 10 \; m/s = 2 \; s \times 10 \; m/s = 20 \; m$.
Total distance $= 10 \; m + 20 \; m = 30 \; m$.
0 likes
View Solution212
MediumMCQ
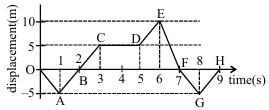
The displacement $x$ versus time graph is shown below. Analyze the following statements:
$(A)$ The average velocity during $0$ to $3\ s$ is $10\ m/s$.
$(B)$ The average velocity during $3$ to $5\ s$ is $0\ m/s$.
$(C)$ The instantaneous velocity at $t = 2\ s$ is $5\ m/s$.
$(D)$ The average velocity during $5$ to $7\ s$ and instantaneous velocity at $t = 6.5\ s$ are equal.
$(E)$ The average velocity from $t = 0$ to $t = 9\ s$ is zero.
Choose the correct answer from the options given below.
A
$(A), (D), (E)$ only
B
$(B), (C), (D)$ only
C
$(B), (D), (E)$ only
D
$(B), (C), (E)$ only
Solution
(D) The average velocity is given by $\langle v \rangle = \frac{\Delta x}{\Delta t} = \frac{x_f - x_i}{t_f - t_i}$. The instantaneous velocity is the slope of the $x-t$ graph,$v = \frac{dx}{dt}$.
$(A)$ From $t = 0$ to $t = 3\ s$: $x_i = 0$,$x_f = 5$. $\langle v \rangle = \frac{5 - 0}{3 - 0} = \frac{5}{3}\ m/s$. Statement $(A)$ is incorrect.
$(B)$ From $t = 3$ to $t = 5\ s$: $x_i = 5$,$x_f = 5$. $\langle v \rangle = \frac{5 - 5}{5 - 3} = 0\ m/s$. Statement $(B)$ is correct.
$(C)$ At $t = 2\ s$,the graph is a straight line passing through $(0, -5)$ and $(2, 0)$. Slope $= \frac{0 - (-5)}{2 - 0} = 2.5\ m/s$. Statement $(C)$ is incorrect.
$(D)$ From $t = 5$ to $t = 7\ s$: $x_i = 5$,$x_f = 0$. $\langle v \rangle = \frac{0 - 5}{7 - 5} = -2.5\ m/s$. At $t = 6.5\ s$,the slope is $\frac{0 - 10}{7 - 6} = -10\ m/s$. Statement $(D)$ is incorrect.
$(E)$ From $t = 0$ to $t = 9\ s$: $x_i = 0$,$x_f = 0$. $\langle v \rangle = \frac{0 - 0}{9 - 0} = 0\ m/s$. Statement $(E)$ is correct.
Wait,re-evaluating the options based on the graph:
$(B)$ is correct $(0\ m/s)$.
$(E)$ is correct $(0\ m/s)$.
Looking at the provided options,$(B), (C), (E)$ is option $(D)$. Let's re-check $(C)$: At $t=2$,the line passes through $(1, -5)$ and $(3, 5)$. Slope $= \frac{5 - (-5)}{3 - 1} = \frac{10}{2} = 5\ m/s$. So $(C)$ is correct.
Thus,$(B), (C), (E)$ are correct.
0 likes
View Solution213
MediumMCQ
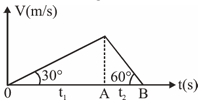
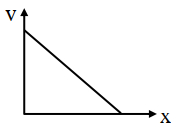
The velocity-time graph of a body moving along a straight line is shown in the figure. The ratio of the average velocities during the time intervals $t_1$ and $t_2$ is:
A
$1 : 1$
B
$2 : 1$
C
$3 : 1$
D
$1 : 3$
Solution
(A) The average velocity is given by the total displacement divided by the total time. The displacement is equal to the area under the velocity-time graph.
Let $V_{max}$ be the maximum velocity at time $t_1$. From the graph,we have:
$V_{max} = t_1 \tan(30^\circ) = t_2 \tan(60^\circ)$
$V_{max} = t_1 \left(\frac{1}{\sqrt{3}}\right) = t_2 (\sqrt{3})$
Therefore,$\frac{t_1}{t_2} = \frac{\sqrt{3}}{1/\sqrt{3}} = 3$,which means $t_1 = 3t_2$.
The displacement during time $t_1$ is $S_1 = \frac{1}{2} \times t_1 \times V_{max}$.
The average velocity during $t_1$ is $V_{avg1} = \frac{S_1}{t_1} = \frac{1}{2} V_{max}$.
The displacement during time $t_2$ is $S_2 = \frac{1}{2} \times t_2 \times V_{max}$.
The average velocity during $t_2$ is $V_{avg2} = \frac{S_2}{t_2} = \frac{1}{2} V_{max}$.
Thus,the ratio of the average velocities is $\frac{V_{avg1}}{V_{avg2}} = \frac{\frac{1}{2} V_{max}}{\frac{1}{2} V_{max}} = 1 : 1$.
0 likes
View Solution214
DifficultMCQ
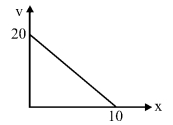
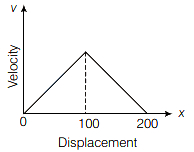
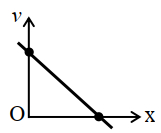
The given graph shows the variation of velocity with displacement. Which one of the graphs given below correctly represents the variation of acceleration with displacement?
A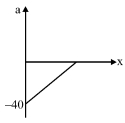
B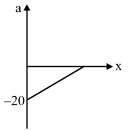
C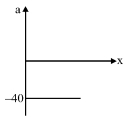
D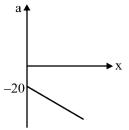
Solution
(A) From the given $v-x$ graph,the equation of the straight line is $v = mx + c$.
Here,the intercept $c = 20$ and the slope $m = \frac{0 - 20}{10 - 0} = -2$.
So,the equation is $v = -2x + 20$.
We know that acceleration $a = v \frac{dv}{dx}$.
First,find $\frac{dv}{dx} = \frac{d}{dx}(-2x + 20) = -2$.
Now,substitute $v$ and $\frac{dv}{dx}$ into the acceleration formula:
$a = (-2x + 20)(-2) = 4x - 40$.
This is the equation of a straight line with a slope of $4$ and a y-intercept of $-40$.
At $x = 0$,$a = -40$.
At $x = 10$,$a = 4(10) - 40 = 0$.
Thus,the graph represents a straight line starting from $a = -40$ at $x = 0$ and reaching $a = 0$ at $x = 10$.
Therefore,option $A$ is correct.
0 likes
View Solution215
EasyMCQ
The acceleration of a moving body can be found from
A
area under velocity-time graph.
B
area under distance-time graph.
C
slope of the velocity-time graph.
D
slope of the distance-time graph.
Solution
(C) The acceleration of a moving body is defined as the rate of change of velocity with respect to time.
Mathematically,$a = \frac{dv}{dt}$.
In a velocity-time graph,the slope is defined as $\frac{\Delta v}{\Delta t}$,which represents the instantaneous or average acceleration.
Therefore,the slope of the velocity-time graph gives the acceleration of the body.
Mathematically,$a = \frac{dv}{dt}$.
In a velocity-time graph,the slope is defined as $\frac{\Delta v}{\Delta t}$,which represents the instantaneous or average acceleration.
Therefore,the slope of the velocity-time graph gives the acceleration of the body.
0 likes
View Solution216
EasyMCQ
$A$ velocity-time graph of a body is shown below. The distance covered by the body from $t = 6 \ s$ to $t = 9 \ s$ is: (in $m$)
A
$22.5$
B
$60.0$
C
$65.0$
D
$120.0$
Solution
(D) The distance covered by a body in a velocity-time graph is equal to the area under the curve between the given time intervals.
Step $1$: Identify the shape of the graph from $t = 6 \ s$ to $t = 9 \ s$.
At $t = 6 \ s$,$v = 20 \ m/s$. At $t = 9 \ s$,the velocity is $30 \ m/s$ (since the graph is a straight line from $(6, 20)$ to $(10, 40)$,the slope is $m = (40-20)/(10-6) = 5$. Thus,at $t = 9 \ s$,$v = 20 + 5(9-6) = 35 \ m/s$).
Step $2$: Calculate the area of the trapezoid formed between $t = 6 \ s$ and $t = 9 \ s$.
The parallel sides are $v_1 = 20 \ m/s$ and $v_2 = 35 \ m/s$. The height (time interval) is $h = 9 - 6 = 3 \ s$.
Area $= \frac{1}{2} \times (v_1 + v_2) \times h = \frac{1}{2} \times (20 + 35) \times 3 = \frac{1}{2} \times 55 \times 3 = 82.5 \ m$.
0 likes
View Solution217
MediumMCQ
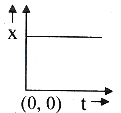
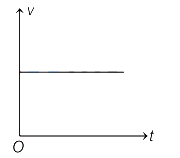
The following figure shows the variation of displacement $x$ with time $t$ for a particular object. Identify the correct interpretation of the graph.
A
The graph shows an object at rest.
B
The graph shows an object moving with uniform velocity in the positive $x$ direction.
C
The graph shows an object moving with uniform velocity in the negative $x$ direction.
D
The graph shows an object moving with non-uniform acceleration.
Solution
(A) In the given displacement-time graph,the position $x$ of the object remains constant as time $t$ increases.
Since the slope of the displacement-time graph represents velocity $(v = dx/dt)$,and the slope of a horizontal line is zero,the velocity of the object is zero.
Therefore,the graph indicates that the object is at rest.
Since the slope of the displacement-time graph represents velocity $(v = dx/dt)$,and the slope of a horizontal line is zero,the velocity of the object is zero.
Therefore,the graph indicates that the object is at rest.
0 likes
View Solution218
MediumMCQ
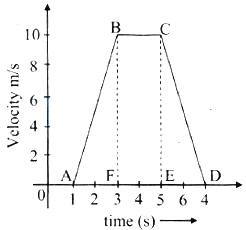
For the velocity-time graph shown in the figure,the distance covered by the body in the last two seconds of its motion is $S_1$. What is the ratio of $S_1$ to the total distance covered by it?
A
$\frac{1}{2}$
B
$\frac{1}{4}$
C
$\frac{1}{3}$
D
$\frac{2}{3}$
Solution
(B) The distance covered is equal to the area enclosed by the velocity-time graph with the time axis.
Total distance covered in the interval from $t = 1 \ s$ to $t = 7 \ s$ (as per the graph,the motion ends at $t = 7 \ s$):
The area is a trapezoid with parallel sides of length $(5-3) = 2 \ s$ and $(7-1) = 6 \ s$,and height $10 \ m/s$.
Total distance $S = \frac{1}{2} \times (2 + 6) \times 10 = 40 \ m$.
Distance covered in the last two seconds (from $t = 5 \ s$ to $t = 7 \ s$):
This is a triangle with base $(7-5) = 2 \ s$ and height $10 \ m/s$.
$S_1 = \frac{1}{2} \times 2 \times 10 = 10 \ m$.
Therefore,the ratio is $\frac{S_1}{S} = \frac{10}{40} = \frac{1}{4}$.
0 likes
View Solution219
MediumMCQ
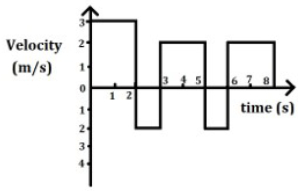
The velocity-time graph of a body moving in a straight line is shown in the figure. The ratio of displacement to distance travelled by the body in time $t = 0$ to $t = 8 \ s$ is:
A
$8: 5$
B
$3: 5$
C
$5: 9$
D
$7: 4$
Solution
(C) Displacement is the area under the velocity-time graph considering the sign of velocity. Distance is the area under the velocity-time graph taking the absolute value of velocity.
For $t = 0$ to $2 \ s$: Velocity $v = 3 \ m/s$. Area $= 3 \times 2 = 6 \ m$.
For $t = 2$ to $3 \ s$: Velocity $v = -2 \ m/s$. Area $= -2 \times 1 = -2 \ m$.
For $t = 3$ to $5 \ s$: Velocity $v = 2 \ m/s$. Area $= 2 \times 2 = 4 \ m$.
For $t = 5$ to $6 \ s$: Velocity $v = -2 \ m/s$. Area $= -2 \times 1 = -2 \ m$.
For $t = 6$ to $8 \ s$: Velocity $v = 2 \ m/s$. Area $= 2 \times 2 = 4 \ m$.
Total Displacement $= 6 - 2 + 4 - 2 + 4 = 10 \ m$.
Total Distance $= |6| + |-2| + |4| + |-2| + |4| = 6 + 2 + 4 + 2 + 4 = 18 \ m$.
Ratio of displacement to distance $= 10 / 18 = 5 / 9$.
0 likes
View Solution220
MediumMCQ
Two cars $A$ and $B$ start from a point at the same time in a straight line and their positions are represented by $R_{A}(t) = at + bt^2$ and $R_{B}(t) = xt - t^2$. At what time do the cars have the same velocity?
A
$\frac{x-a}{2(b+1)}$
B
$\frac{x+a}{2(b-1)}$
C
$\frac{x-a}{(b+1)}$
D
$\frac{x+a}{(b-1)}$
Solution
(A) The velocity of an object is the time derivative of its position function,$V(t) = \frac{dR}{dt}$.
For car $A$: $V_{A}(t) = \frac{d}{dt}(at + bt^2) = a + 2bt$.
For car $B$: $V_{B}(t) = \frac{d}{dt}(xt - t^2) = x - 2t$.
To find the time $t$ when the cars have the same velocity,we set $V_{A} = V_{B}$:
$a + 2bt = x - 2t$
Rearranging the terms to solve for $t$:
$2bt + 2t = x - a$
$t(2b + 2) = x - a$
$t = \frac{x - a}{2(b + 1)}$.
0 likes
View Solution221
EasyMCQ
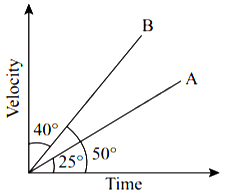
The velocity-time graph for two bodies $A$ and $B$ is shown. Then the acceleration of $A$ and $B$ are in the ratio:
A
$\tan 25^{\circ}$ to $\tan 40^{\circ}$
B
$\tan 25^{\circ}$ to $\tan 50^{\circ}$
C
$\sin 25^{\circ}$ to $\sin 50^{\circ}$
D
$\cos 25^{\circ}$ to $\cos 50^{\circ}$
Solution
(B) The acceleration of a body is given by the slope of its velocity-time graph.
Acceleration $a = \frac{dv}{dt} = \tan \theta$,where $\theta$ is the angle the line makes with the time axis.
For body $A$,the angle with the time axis is $25^{\circ}$. Thus,$a_A = \tan 25^{\circ}$.
For body $B$,the angle with the time axis is $50^{\circ}$. Thus,$a_B = \tan 50^{\circ}$.
Therefore,the ratio of the acceleration of $A$ to the acceleration of $B$ is $\frac{a_A}{a_B} = \frac{\tan 25^{\circ}}{\tan 50^{\circ}}$.
0 likes
View Solution222
EasyMCQ
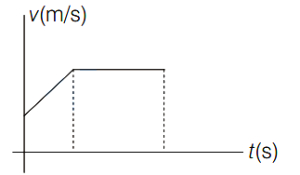
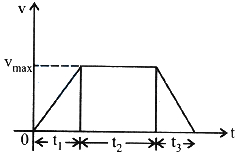
For a body moving along a straight line, the following $v-t$ graph is obtained. According to the graph, the displacement during
A
uniform acceleration is greater than that during uniform motion
B
uniform acceleration is less than that during uniform motion
C
uniform acceleration is equal to that during uniform motion
D
uniform motion is zero
Solution
(B) The displacement of an object is given by the area under the $v-t$ graph.
$s = \text{Area under } v-t \text{ graph}$
In the given graph, the area under the uniform motion part (a rectangle) is greater than the area under the uniform acceleration part (a trapezoid) for the same time interval.
Therefore, the displacement during uniform acceleration is less than that during uniform motion.
0 likes
View Solution223
EasyMCQ
The given graph shows the variation of velocity $(v)$ with position $(x)$ for a particle moving along a straight line. Which of the following graphs shows the variation of acceleration $(a)$ with position $(x)$?
A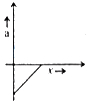
B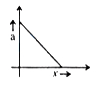
C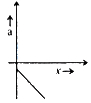
D
Solution
(A) The given graph is a straight line with a positive intercept on the $v$-axis and a negative slope.
Its equation can be written as:
$v = -mx + v_0 \dots(1)$
where $m = \tan \theta = \frac{v_0}{x_0}$ is the magnitude of the slope.
The acceleration $a$ is given by $a = v \frac{dv}{dx}$.
From equation $(1)$,differentiating $v$ with respect to $x$ gives:
$\frac{dv}{dx} = -m$
Substituting this into the expression for acceleration:
$a = v(-m) = (-mx + v_0)(-m)$
$a = m^2x - mv_0$
This is the equation of a straight line with a positive slope $(m^2)$ and a negative intercept $(-mv_0)$ on the acceleration axis.
Comparing this with the given options,graph $(A)$ represents a straight line with a negative intercept and a positive slope.
Therefore,option $(A)$ is correct.
0 likes
View Solution224
EasyMCQ
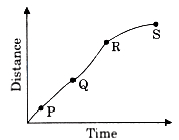
$A$ particle shows a distance-time curve as shown in the figure. The maximum instantaneous velocity of the particle is around the point:
A
$P$
B
$S$
C
$R$
D
$Q$
Solution
(D) In a distance-time graph,the instantaneous velocity of a particle at any point is given by the slope of the tangent to the curve at that point.
Mathematically,$v = \frac{ds}{dt} = \tan(\theta)$,where $\theta$ is the angle that the tangent makes with the time axis.
The slope is maximum where the curve is steepest.
By observing the given graph,the curve is steepest at point $Q$. Therefore,the instantaneous velocity is maximum around point $Q$.
0 likes
View Solution225
EasyMCQ
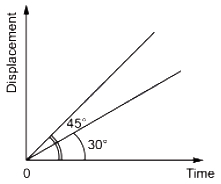
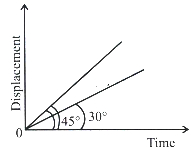
The displacement-time graph of two moving particles makes angles of $30^{\circ}$ and $45^{\circ}$ with the time axis ($X$-axis). The ratio of their velocities is
A
$\sqrt{3}: 2$
B
$1: 1$
C
$1: 2$
D
$1: \sqrt{3}$
Solution
(D) By definition,the slope of a displacement-time graph represents the velocity of the particle.
$v = \tan \theta$
Given the angles $\theta_1 = 30^{\circ}$ and $\theta_2 = 45^{\circ}$.
The ratio of their velocities is given by:
$\frac{v_1}{v_2} = \frac{\tan \theta_1}{\tan \theta_2}$
Substituting the values:
$\frac{v_1}{v_2} = \frac{\tan 30^{\circ}}{\tan 45^{\circ}}$
Since $\tan 30^{\circ} = \frac{1}{\sqrt{3}}$ and $\tan 45^{\circ} = 1$,we get:
$\frac{v_1}{v_2} = \frac{1/\sqrt{3}}{1} = \frac{1}{\sqrt{3}}$
Thus,the ratio is $1: \sqrt{3}$.
0 likes
View Solution226
MediumMCQ
$A$ particle starts from rest and moves in a straight line. It travels a distance $2L$ with uniform acceleration and then moves with a constant velocity for a further distance of $L$. Finally,it comes to rest after moving a distance of $3L$ under uniform retardation. Then the ratio of average speed to the maximum speed $\left(\frac{\bar{V}}{V_m}\right)$ of the particle is
A
$\frac{6}{11}$
B
$\frac{7}{11}$
C
$\frac{5}{11}$
D
$\frac{2}{11}$
Solution
(A) The $v$-$t$ graph of the particle is shown in the figure.
$1$. For the first part (uniform acceleration):
Distance $2L = \frac{1}{2} \times V_m \times t_1 \implies t_1 = \frac{4L}{V_m}$
$2$. For the second part (constant velocity):
Distance $L = V_m \times t_2 \implies t_2 = \frac{L}{V_m}$
$3$. For the third part (uniform retardation):
Distance $3L = \frac{1}{2} \times V_m \times t_3 \implies t_3 = \frac{6L}{V_m}$
$4$. Average speed $\bar{V} = \frac{\text{Total distance}}{\text{Total time}}$
Total distance $= 2L + L + 3L = 6L$
Total time $= t_1 + t_2 + t_3 = \frac{4L}{V_m} + \frac{L}{V_m} + \frac{6L}{V_m} = \frac{11L}{V_m}$
$5$. Therefore,$\bar{V} = \frac{6L}{11L/V_m} = \frac{6}{11} V_m$
$\frac{\bar{V}}{V_m} = \frac{6}{11}$
0 likes
View Solution227
MediumMCQ
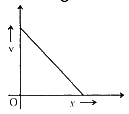
Among the following,the velocity $(v)$ - time $(t)$ graph representing the motion of a vertically projected body is
A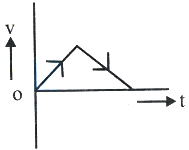
B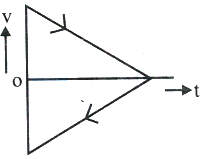
C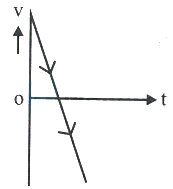
D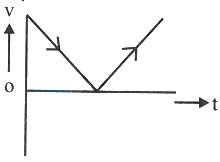
Solution
(C) The velocity of a body projected vertically upwards with an initial velocity $v_{i}$ is given by the equation of motion:
$v_{f} = v_{i} - gt$
where $g$ is the acceleration due to gravity and $t$ is the time.
$1$. Initially,the velocity is positive $(v_{i})$ and decreases linearly with time as the body moves upwards.
$2$. At the maximum height,the velocity becomes zero $(v_{f} = 0)$ at time $t = \frac{v_{i}}{g}$.
$3$. After reaching the maximum height,the body starts moving downwards,so the velocity becomes negative and increases in magnitude linearly with time.
This behavior is represented by a straight line with a constant negative slope $(-g)$ that passes through the positive $v$-axis,crosses the $t$-axis at $t = \frac{v_{i}}{g}$,and continues into the negative $v$-region. Graph $C$ correctly depicts this linear decrease in velocity from a positive value to a negative value.
0 likes
View Solution228
EasyMCQ
The slope of the velocity-time graph for motion with uniform velocity is equal to:
A
initial velocity
B
final velocity
C
zero
D
constant velocity
Solution
(C) We know that uniform velocity is independent of time. Therefore,in a velocity-time graph,the graph is represented as a straight line parallel to the time axis.
Since the slope of a line is given by $\text{slope} = \tan \theta$,where $\theta$ is the angle the line makes with the horizontal time axis.
From the graph,the line is parallel to the time axis,so $\theta = 0^{\circ}$.
Therefore,$\text{slope} = \tan 0^{\circ} = 0$.
Since the slope of a line is given by $\text{slope} = \tan \theta$,where $\theta$ is the angle the line makes with the horizontal time axis.
From the graph,the line is parallel to the time axis,so $\theta = 0^{\circ}$.
Therefore,$\text{slope} = \tan 0^{\circ} = 0$.
0 likes
View Solution229
MediumMCQ
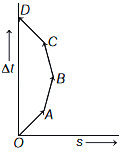
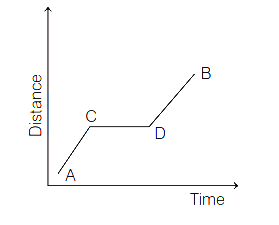
Which of the following options is correct for the object having a straight-line motion represented by the following graph?
A
The object moves with constantly increasing velocity from $O$ to $A$ and then it moves with constant velocity.
B
Velocity of the object increases uniformly.
C
The graph shown is impossible.
D
Average velocity is zero.
Solution
(C) In the given graph,the $y$-axis represents time $(t)$ and the $x$-axis represents displacement $(s)$.
For a physical motion,time must always increase as the object moves.
In the given graph,as the object moves from $B$ to $C$ and then to $D$,the displacement $s$ decreases while time $t$ continues to increase.
However,at any given time $t$,an object can only have one position $s$.
Looking at the graph,for a single value of time $t$ (on the vertical axis),there are multiple values of displacement $s$ (on the horizontal axis) possible,which is physically impossible for a single object in motion.
Furthermore,the graph shows the object moving backward in displacement,which is possible,but the specific shape implies that for a single time instant,the object is at multiple positions,or more accurately,the slope $\frac{dt}{ds}$ is plotted instead of $\frac{ds}{dt}$.
Since time cannot decrease or be multi-valued for a single position,this graph is physically impossible.
0 likes
View Solution230
DifficultMCQ
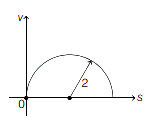
The velocity-displacement $(v-s)$ graph shows the motion of a particle moving in a straight line. The velocity-displacement graph is a circle of radius $2 \ m$ and the center is at $(2, 0) \ m$. The value of acceleration for this particle at a point $(2-\sqrt{2}, \sqrt{2}) \ m$ will be $ms^{-2}$.
A
$\sqrt{2}$
B
$4$
C
$2$
D
$3$
Solution
(A) The graph is a circle with center $(2, 0)$ and radius $2 \ m$. Its equation is given by:
$(s-2)^2 + v^2 = 2^2$
$(s-2)^2 + v^2 = 4$
Differentiating both sides with respect to time $t$,we get:
$2(s-2) \frac{ds}{dt} + 2v \frac{dv}{dt} = 0$
Since $\frac{ds}{dt} = v$ and $\frac{dv}{dt} = a$,we substitute these into the equation:
$2(s-2)v + 2v \cdot a = 0$
Dividing by $2v$ (assuming $v \neq 0$):
$(s-2) + a = 0$
$a = -(s-2) = 2-s$
At the point $(s, v) = (2-\sqrt{2}, \sqrt{2})$:
$a = 2 - (2-\sqrt{2}) = \sqrt{2} \ ms^{-2}$
0 likes
View Solution231
DifficultMCQ
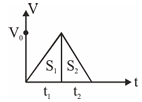
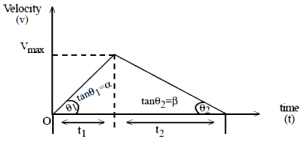
From the $v-t$ graph,find the total distance covered by the car in time $t = t_1 + t_2$.
A
$\frac{1}{2} \left( \frac{\alpha \beta}{\alpha + \beta} \right) t^2$
B
$\frac{\alpha \beta t}{\alpha + \beta}$
C
$\alpha t + \frac{1}{2} \left( \frac{\alpha \beta}{\alpha + \beta} \right) t^2$
D
$\frac{1}{2} \left( \frac{\alpha + \beta}{\alpha \beta} \right) t^2$
Solution
(A) The total distance covered is equal to the area under the $v-t$ graph.
From the graph,the maximum velocity $V_{max}$ is reached at time $t_1$.
We have $\tan \theta_1 = \alpha = \frac{V_{max}}{t_1} \implies t_1 = \frac{V_{max}}{\alpha}$.
Similarly,$\tan \theta_2 = \beta = \frac{V_{max}}{t_2} \implies t_2 = \frac{V_{max}}{\beta}$.
The total time is $t = t_1 + t_2 = V_{max} \left( \frac{1}{\alpha} + \frac{1}{\beta} \right) = V_{max} \left( \frac{\alpha + \beta}{\alpha \beta} \right)$.
Thus,$V_{max} = \frac{\alpha \beta t}{\alpha + \beta}$.
The total distance $S$ is the area of the triangle with base $t$ and height $V_{max}$:
$S = \frac{1}{2} \times \text{base} \times \text{height} = \frac{1}{2} \times t \times V_{max}$.
Substituting $V_{max}$,we get $S = \frac{1}{2} \times t \times \left( \frac{\alpha \beta t}{\alpha + \beta} \right) = \frac{1}{2} \left( \frac{\alpha \beta}{\alpha + \beta} \right) t^2$.
0 likes
View Solution232
EasyMCQ
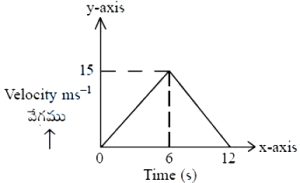
The velocity-time graph for a particle moving in a straight line is shown in the figure. The average velocity between $t=4 \,s$ and $t=6 \,s$ is . . . . . . (in $\,ms^{-1}$)
A
$10.5$
B
$12.5$
C
$7.5$
D
$9.5$
Solution
(B) The average velocity is defined as the total displacement divided by the total time interval: $v_{avg} = \frac{\Delta x}{\Delta t}$.
Displacement $\Delta x$ is the area under the velocity-time graph between $t=4 \,s$ and $t=6 \,s$.
At $t=6 \,s$, $v=15 \,ms^{-1}$. The graph is a straight line from $(0,0)$ to $(6,15)$, so the equation for velocity is $v(t) = \frac{15}{6}t = 2.5t$.
At $t=4 \,s$, $v(4) = 2.5 \times 4 = 10 \,ms^{-1}$.
The area under the graph between $t=4 \,s$ and $t=6 \,s$ is a trapezoid with parallel sides $v(4)=10 \,ms^{-1}$ and $v(6)=15 \,ms^{-1}$, and height $\Delta t = 6-4 = 2 \,s$.
Area = $\frac{1}{2} \times (v(4) + v(6)) \times \Delta t = \frac{1}{2} \times (10 + 15) \times 2 = 25 \,m$.
Average velocity $v_{avg} = \frac{25 \,m}{2 \,s} = 12.5 \,ms^{-1}$.
Thus, the correct option is $B$.
0 likes
View Solution233
DifficultMCQ
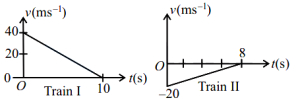
Two trains, which are moving along different tracks in opposite directions, are put on the same track by mistake. On noticing the mistake, when the trains are $300 \, m$ apart, the drivers start slowing down the trains. The graphs given below show the decrease in their velocities as a function of time. The separation between the trains when both have stopped is: (in $ \, m$)
A
$120$
B
$20$
C
$60$
D
$280$
Solution
(B) The initial distance between the trains is $d_0 = 300 \, m$.
The distance covered by a train is equal to the area under its velocity-time graph.
For Train $I$, the area under the $v-t$ graph is $A_1 = \frac{1}{2} \times \text{base} \times \text{height} = \frac{1}{2} \times 10 \, s \times 40 \, m/s = 200 \, m$.
For Train $II$, the magnitude of the area under the $v-t$ graph is $A_2 = \frac{1}{2} \times \text{base} \times \text{height} = \frac{1}{2} \times 8 \, s \times 20 \, m/s = 80 \, m$.
Since the trains are moving in opposite directions towards each other, the total distance covered by both trains before stopping is $d_{total} = A_1 + A_2 = 200 \, m + 80 \, m = 280 \, m$.
The final separation between the trains when both have stopped is $d_{final} = d_0 - d_{total} = 300 \, m - 280 \, m = 20 \, m$.
0 likes
View Solution234
MediumMCQ
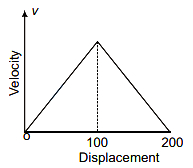
The velocity $(v)$ versus displacement $(x)$ plot of a body moving along a straight line is as shown in the graph. The corresponding plot of acceleration $(a)$ as a function of displacement $(x)$ is
A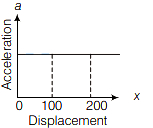
B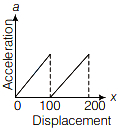
C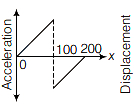
D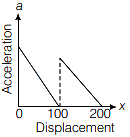
Solution
(D) The acceleration $a$ is given by $a = v \frac{dv}{dx}$.
From the given graph,the velocity $v$ is a linear function of displacement $x$.
For the interval $0 \le x \le 100$,the slope is positive. Let $v = kx$ (where $k > 0$). Then,$a = v \frac{dv}{dx} = (kx)(k) = k^2 x$. This shows that $a$ increases linearly with $x$ in this interval.
For the interval $100 \le x \le 200$,the slope is negative. Let $v = -k(x - 200) = -kx + 200k$. Then,$a = v \frac{dv}{dx} = (-kx + 200k)(-k) = k^2 x - 200k^2$. This shows that $a$ increases linearly with $x$ in this interval,but with a negative intercept.
Comparing this with the given options,the graph that shows a positive linear increase in acceleration for the first part and a positive linear increase with a negative value for the second part is option $D$.
0 likes
View Solution235
DifficultMCQ
$y = (P t^2 - Q t^3) \ m$ is the vertical displacement of a ball which is moving in a vertical plane. Then the maximum height that the ball can reach is,
A
$\frac{27 P^3}{4 Q^2}$
B
$\frac{4 Q^2}{27 P^3}$
C
$\frac{4 P^3}{27 Q^2}$
D
$\frac{27 Q^2}{4 P^3}$
Solution
(C) Velocity is defined as the rate of change of displacement.
$v_y = \frac{dy}{dt}$
$= \frac{d(P t^2 - Q t^3)}{dt}$
$= 2Pt - 3Qt^2$
At maximum height,the vertical velocity of the particle becomes zero.
$2Pt - 3Qt^2 = 0$
$t(2P - 3Qt) = 0$
Since $t=0$ is the start of the motion,the time at maximum height is $t = \frac{2P}{3Q}$.
Now,substituting this time into the displacement equation:
$y_{max} = P(\frac{2P}{3Q})^2 - Q(\frac{2P}{3Q})^3$
$= P(\frac{4P^2}{9Q^2}) - Q(\frac{8P^3}{27Q^3})$
$= \frac{4P^3}{9Q^2} - \frac{8P^3}{27Q^2}$
$= \frac{12P^3 - 8P^3}{27Q^2}$
$= \frac{4P^3}{27Q^2}$
0 likes
View Solution236
MediumMCQ
The displacement-time graphs of two moving particles make angles of $30^{\circ}$ and $45^{\circ}$ with the time axis. The ratio of their velocities is
A
$\sqrt{3}: 2$
B
$1: 1$
C
$1: 2$
D
$1: \sqrt{3}$
Solution
(D) The velocity $v$ of a particle is given by the slope of the displacement-time graph,which is $v = \tan(\theta)$,where $\theta$ is the angle the graph makes with the time axis.
For the first particle,$\theta_1 = 30^{\circ}$,so its velocity $v_1 = \tan(30^{\circ}) = \frac{1}{\sqrt{3}}$.
For the second particle,$\theta_2 = 45^{\circ}$,so its velocity $v_2 = \tan(45^{\circ}) = 1$.
The ratio of their velocities is $\frac{v_1}{v_2} = \frac{\tan(30^{\circ})}{\tan(45^{\circ})} = \frac{1/\sqrt{3}}{1} = 1 : \sqrt{3}$.
0 likes
View Solution237
EasyMCQ
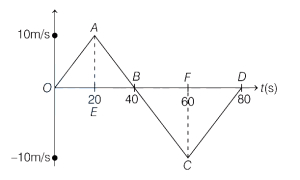
For the following velocity-time graph, the average speed for the motion during first $80 \, s$ is
A
$0$
B
$5 \, m/s$
C
$10 \, m/s$
D
$0.25 \, m/s$
Solution
(B) As we know that, distance is equal to the area under the velocity-time graph. Since average speed is defined as the total distance traveled divided by the total time taken, we must consider the magnitude of the area for both positive and negative velocity intervals.
Total distance traveled in $80 \, s$ is the sum of the absolute areas of the triangles formed:
$Distance = |Area_{OAB}| + |Area_{BCD}|$
Area of triangle $OAB$ (from $t=0$ to $t=40 \, s$):
$Area_{OAB} = \frac{1}{2} \times \text{base} \times \text{height} = \frac{1}{2} \times 40 \, s \times 10 \, m/s = 200 \, m$
Area of triangle $BCD$ (from $t=40$ to $t=80 \, s$):
$Area_{BCD} = \frac{1}{2} \times \text{base} \times |\text{height}| = \frac{1}{2} \times 40 \, s \times |-10 \, m/s| = 200 \, m$
Total distance $= 200 \, m + 200 \, m = 400 \, m$
Total time taken $= 80 \, s$
Average speed $= \frac{\text{Total distance}}{\text{Total time}} = \frac{400 \, m}{80 \, s} = 5 \, m/s$
0 likes
View Solution238
EasyMCQ
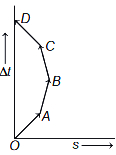
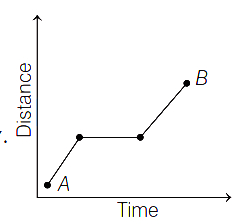
$A$ particle covers a distance from $A$ to $B$ over a period of time; the distance versus time plot is shown below. Then which of the following is true for the motion of the particle?
A
Both average speed and instantaneous speed are always zero.
B
Average speed is always non-zero but instantaneous speed can be zero.
C
Instantaneous speed is always non-zero but average speed can be zero.
D
Both average speed and instantaneous speed are always non-zero.
Solution
(B) The distance-time graph for the motion of a particle from $A$ to $B$ is shown in the diagram.
From the graph,the slope of the distance-time graph for the segments $A$ to $C$ and $D$ to $B$ is positive,which means the speed is non-zero in these intervals.
Average speed is defined as the total distance covered divided by the total time taken. Since the total distance covered from $A$ to $B$ is non-zero,the average speed is always non-zero.
Instantaneous speed is the slope of the distance-time graph at any given instant. In the segment $C$ to $D$,the graph is a horizontal line,meaning the distance does not change with time. Therefore,the slope is zero,which implies the instantaneous speed is zero during this interval.
Thus,the average speed is always non-zero,but the instantaneous speed can be zero. Hence,option $B$ is correct.
0 likes
View Solution239
MediumMCQ
$A$ particle is moving along the $Y$-axis. The position of the particle from the origin as a function of time $(t)$ is given as $y(t) = 10 t e^{-2 t}$. How far is the particle from the origin when it stops momentarily? ($y$ is given in units of metre and $t$ is in units of second)
A
$5 \ m$
B
$5 e \ m$
C
$\frac{5}{e} \ m$
D
$10 \ m$
Solution
(C) The position of the particle is given by the function $y(t) = 10 t e^{-2 t}$.
To find when the particle stops momentarily,we calculate its velocity $v$ by differentiating $y(t)$ with respect to time $t$:
$v = \frac{dy}{dt} = \frac{d}{dt} (10 t e^{-2 t})$.
Using the product rule,$v = 10 [t \cdot (-2 e^{-2 t}) + e^{-2 t} \cdot 1] = 10 e^{-2 t} (1 - 2 t)$.
The particle stops momentarily when $v = 0$,which implies $1 - 2 t = 0$,so $t = \frac{1}{2} \ s$.
Now,substitute $t = \frac{1}{2} \ s$ into the position equation to find the distance from the origin:
$y(\frac{1}{2}) = 10 \times (\frac{1}{2}) \times e^{-2 \times (\frac{1}{2})} = 5 \times e^{-1} = \frac{5}{e} \ m$.
0 likes
View Solution240
EasyMCQ
$A$ bird flies with a velocity $(t-2) \text{ m/s}$ along a straight line, where $t$ is the time in seconds. The distance covered by it in a time of $4 \text{ s}$ is: (in $\text{ m}$)
A
$2$
B
$4$
C
$6$
D
$8$
Solution
(B) The velocity of the bird is given by $v(t) = t - 2$.
Since distance is the integral of the magnitude of velocity, we calculate:
$\text{Distance} = \int_{0}^{4} |v(t)| \text{ dt} = \int_{0}^{4} |t - 2| \text{ dt}$.
We split the integral at $t = 2 \text{ s}$ where the velocity changes sign:
$\text{Distance} = \int_{0}^{2} -(t - 2) \text{ dt} + \int_{2}^{4} (t - 2) \text{ dt}$.
Evaluating the first part:
$\int_{0}^{2} (2 - t) \text{ dt} = [2t - \frac{t^2}{2}]_{0}^{2} = (4 - 2) - 0 = 2 \text{ m}$.
Evaluating the second part:
$\int_{2}^{4} (t - 2) \text{ dt} = [\frac{t^2}{2} - 2t]_{2}^{4} = (8 - 8) - (2 - 4) = 0 - (-2) = 2 \text{ m}$.
Total distance $= 2 \text{ m} + 2 \text{ m} = 4 \text{ m}$.
0 likes
View Solution241
MediumMCQ
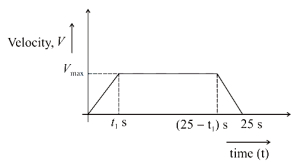
Consider a car initially at rest,starts to move along a straight road first with acceleration $5 \ m \ s^{-2}$,then with uniform velocity and finally,decelerating at $5 \ m \ s^{-2}$,before coming to a stop. Total time taken from start to end is $t = 25 \ s$. If the average velocity during that time is $72 \ km \ hr^{-1}$,the car moved with uniform velocity for a time of: (in $s$)
A
$15$
B
$30$
C
$155$
D
$2$
Solution
(A) The velocity-time graph is a trapezoid. Let the car accelerate for time $t_1$ and decelerate for time $t_1$. The time for which it moves with uniform velocity is $(25 - 2t_1) \ s$.
Maximum velocity $v_{max} = a \times t_1 = 5t_1$.
Average velocity $v_{avg} = 72 \ km \ hr^{-1} = 72 \times \frac{5}{18} \ m \ s^{-1} = 20 \ m \ s^{-1}$.
Total displacement $S = v_{avg} \times t_{total} = 20 \times 25 = 500 \ m$.
The area under the velocity-time graph is the displacement:
$S = \frac{1}{2} \times (\text{sum of parallel sides}) \times \text{height}$
$500 = \frac{1}{2} \times [ (25 - 2t_1) + 25 ] \times 5t_1$
$1000 = (50 - 2t_1) \times 5t_1$
$1000 = 250t_1 - 10t_1^2$
$10t_1^2 - 250t_1 + 1000 = 0$
$t_1^2 - 25t_1 + 100 = 0$
$(t_1 - 20)(t_1 - 5) = 0$
Since $t_1$ must be less than $12.5 \ s$ (as $2t_1 < 25$),we have $t_1 = 5 \ s$.
The time for which the car moved with uniform velocity is $25 - 2t_1 = 25 - 2(5) = 15 \ s$.
0 likes
View Solution242
DifficultMCQ
The velocity $(v)$ - distance $(x)$ graph is shown in the figure. Which graph represents the acceleration $(a)$ versus distance $(x)$ variation of this system?
A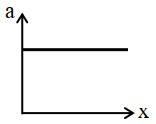
B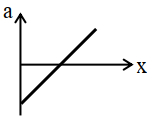
C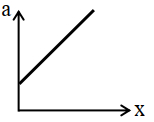
D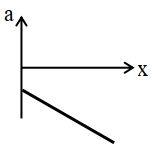
Solution
(B) The equation of the $v$ vs $x$ graph is a straight line with a negative slope and a positive intercept on the $v$-axis:
$v = C_1 - C_2 x$,where $C_1$ and $C_2$ are positive constants.
The acceleration $a$ is given by the relation:
$a = v \frac{dv}{dx}$
Substituting the expression for $v$ and its derivative $\frac{dv}{dx} = -C_2$:
$a = (C_1 - C_2 x) \times (-C_2)$
$a = C_2^2 x - C_1 C_2$
This equation is of the form $a = mx + c$,where the slope $m = C_2^2$ (positive) and the intercept $c = -C_1 C_2$ (negative).
Thus,the graph of $a$ versus $x$ is a straight line with a positive slope and a negative intercept on the $a$-axis,which corresponds to option $B$.
0 likes
View Solution243
MediumMCQ
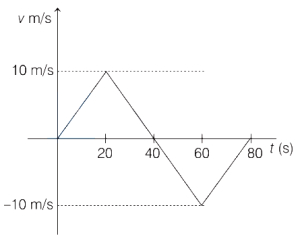
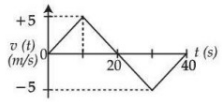
The velocity $(v)$ versus time $(t)$ plot of a particle is shown in the figure,for a time interval of $40 \text{ s}$. The total distance travelled by the particle and the average velocity during this period are,respectively . . . . . . .
A
$25 \text{ m}$ and zero
B
$50 \text{ m}$ and zero
C
$100 \text{ m}$ and zero
D
$100 \text{ m}$ and $2.5 \text{ m/s}$
Solution
(C) Distance is the total path length covered,which is the sum of the areas under the $|v|$ vs $t$ graph.
For the interval $0$ to $20 \text{ s}$,the area of the triangle is $A_1 = 1/2 \times 20 \times 5 = 50 \text{ m}$.
For the interval $20$ to $40 \text{ s}$,the magnitude of velocity is $5 \text{ m/s}$,so the area is $A_2 = 1/2 \times 20 \times 5 = 50 \text{ m}$.
Total distance $= A_1 + A_2 = 50 + 50 = 100 \text{ m}$.
Displacement is the net change in position,which is the algebraic sum of the areas under the $v$ vs $t$ graph.
Displacement $= A_1 - A_2 = 50 - 50 = 0 \text{ m}$.
Average velocity $= \text{Displacement} / \text{Total time} = 0 / 40 = 0 \text{ m/s}$.
0 likes
View Solution244
MediumMCQ
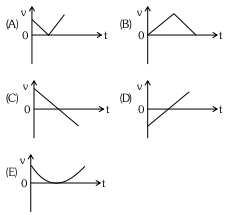
The following plots show the variation of velocity $(v)$ with time $(t)$ for a ball thrown vertically upward and falling back. Which of the following plots is correct?
A
Plot $(A)$
B
Plot $(B)$
C
Plot $(C)$
D
Plot $(D)$
Solution
(C) When a ball is thrown vertically upward with an initial velocity $u$,its velocity at any time $t$ is given by the equation of motion: $v = u - gt$,where $g$ is the acceleration due to gravity.
$1$. Initially,the velocity is positive $(v = u)$.
$2$. As the ball rises,the velocity decreases linearly with time because of the constant downward acceleration $g$.
$3$. At the maximum height,the velocity becomes zero.
$4$. After reaching the maximum height,the ball starts falling downward. During this phase,the velocity becomes negative (as it is directed opposite to the initial upward direction) and its magnitude increases linearly with time.
This linear relationship $v = u - gt$ represents a straight line with a negative slope $(-g)$. Plot $(C)$ correctly depicts this variation,starting from a positive initial velocity,crossing the time axis (where $v = 0$),and continuing into the negative velocity region.
0 likes
View SolutionMotion in Straight Line — Instantaneous Velocity and Speed and Velocity-time Graph · Frequently Asked Questions
1Are these Motion in Straight Line questions useful for JEE and NEET?
Yes. All questions in this section are mapped to JEE Main and NEET exam patterns. Previous year questions from JEE Main, NEET, GUJCET and state-level exams are included with full solutions.
2Can I switch to Hindi or Gujarati for these questions?
Yes. Use the language tabs in the hero section or the sidebar to view the same questions and solutions in English, Hindi or Gujarati.
3How do I generate a question paper from this subtopic?
Use the Vedclass Exam Paper Generator — select the chapter and subtopic, set difficulty, and generate Sets A, B, C, D automatically. First 3 chapters of every subject are free.
Vedclass Products
For Students
Vedclass Test Series
Mock tests in real JEE/NEET style with performance analysis. 5-day free trial.
Start Free TrialFor Teachers
Exam Paper Generator
Generate Set A/B/C/D papers from this chapter in 2 minutes. 3 chapters free.
Try FreeFor Institutes
Online Exam Module
Live online exams with unlimited students, 360° analytics & white-label branding.
See DemoFor Teachers & Institutes
Generate a Motion in Straight Line Exam Paper in 2 Minutes
Select subtopic & difficulty — Sets A, B, C, D auto-generated with No Repeat logic.
First 3 chapters of every subject are free — no payment required.