
Medium
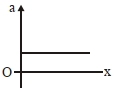
The velocity-displacement graph of a particle is shown in the figure. The acceleration-displacement graph of the same particle is represented by:
- A
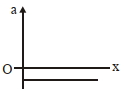
- B
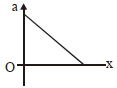
- C
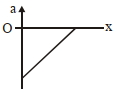
- D
Explore More
Similar Questions
The velocity of a particle moving on the $x$-axis is given by $v = x^2 + x$,where $v$ is in $m/s$ and $x$ is in $m$. Find its acceleration in $m/s^2$ when passing through the point $x = 2 \ m$.
Medium
View SolutionFor the velocity-time graph shown in the figure,what fraction of the total distance covered in all seven seconds is the distance covered by the body in the last two seconds of its motion?
Medium
View Solution$A$ lift is going up. The variation in the velocity of the lift is given in the graph. What is the height to which the lift takes the passengers? (in $m$)
MediumIIT 1970
View SolutionThe given graph shows the variation of velocity $v$ with displacement $x$. Which one of the graphs given below correctly represents the variation of acceleration $a$ with displacement $x$?
DifficultIIT 2005
View Solution$A$ particle starts from rest and undergoes an acceleration as shown in the figure. The velocity-time graph from the figure will have which shape?
Difficult
View SolutionVedclass Products
For Students
Vedclass Test Series
Mock tests in real JEE/NEET style with performance analysis. 5-day free trial.
Start Free TrialFor Teachers
Exam Paper Generator
Generate Set A/B/C/D exam papers from 7.5L+ questions in 2 minutes. 3 chapters free.
Try FreeFor Institutes
Online Exam Module
Live online exams with unlimited students, 360° analytics & white-label branding.
See Demo