
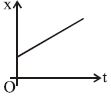
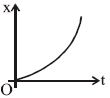
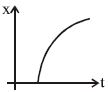
The position $x$ of a particle varies with time $t$ as $x = ct^2 + b$,where $c$ and $b$ are positive constants. Which of the following graphs is correct?
- A
- B

- C
- D
Explore More
Similar Questions
The relation between velocity $v$ and displacement $x$ is $v = x^2$. Find the acceleration at $x = 3 \ m$.
Medium
View SolutionThe position-time graph of a particle moving along a straight line is shown,which is in the form of a semicircle starting from $t=2 \, s$ to $t=8 \, s$. Select the correct statement.
Medium
View SolutionThe displacement-time graphs of two moving particles make angles of $30^{\circ}$ and $45^{\circ}$ with the time-axis as shown in the figure. The ratio of their respective velocities is:
MediumNEET 2022
View SolutionConsider a car initially at rest,starts to move along a straight road first with acceleration $5 \ m \ s^{-2}$,then with uniform velocity and finally,decelerating at $5 \ m \ s^{-2}$,before coming to a stop. Total time taken from start to end is $t = 25 \ s$. If the average velocity during that time is $72 \ km \ hr^{-1}$,the car moved with uniform velocity for a time of: (in $s$)
Two trains, which are moving along different tracks in opposite directions, are put on the same track by mistake. On noticing the mistake, when the trains are $300 \, m$ apart, the drivers start slowing down the trains. The graphs given below show the decrease in their velocities as a function of time. The separation between the trains when both have stopped is: (in $ \, m$)
DifficultAP EAMCET 2016
View SolutionVedclass Products
For Students
Vedclass Test Series
Mock tests in real JEE/NEET style with performance analysis. 5-day free trial.
Start Free TrialFor Teachers
Exam Paper Generator
Generate Set A/B/C/D exam papers from 7.5L+ questions in 2 minutes. 3 chapters free.
Try FreeFor Institutes
Online Exam Module
Live online exams with unlimited students, 360° analytics & white-label branding.
See Demo