
Medium
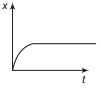
The velocity-time graph for a particle moving along the $x$-axis is shown in the figure. The corresponding displacement-time graph is correctly shown by
- A

- B

- C
- D

Explore More
Similar Questions
The acceleration of a moving body can be found from
The velocity-time graph of an object moving along a straight line is shown in the figure. What is the distance (in $m$) covered by the object between $t = 0$ and $t = 4 \; s$?
Which of the following curves does not represent motion in one dimension?
The $v-t$ graphs of two moving objects make angles of $30^{\circ}$ and $45^{\circ}$ with the time axis. Find the ratio of their accelerations.
Medium
View SolutionFind the acceleration of the particle at $x = 5\,m$ using the given $v^2-x$ graph,where $v$ is velocity and $x$ is displacement.
Medium
View SolutionVedclass Products
For Students
Vedclass Test Series
Mock tests in real JEE/NEET style with performance analysis. 5-day free trial.
Start Free TrialFor Teachers
Exam Paper Generator
Generate Set A/B/C/D exam papers from 7.5L+ questions in 2 minutes. 3 chapters free.
Try FreeFor Institutes
Online Exam Module
Live online exams with unlimited students, 360° analytics & white-label branding.
See Demo