
Medium
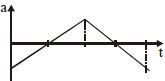
The graph below shows the velocity versus time graph for a body. Which of the following graphs represents the corresponding acceleration $v/s$ time graph?
- A
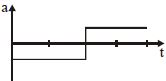
- B
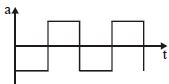
- C
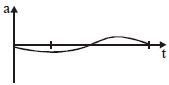
- D
Explore More
Similar Questions
The velocity of a particle moving on the $x$-axis is given by $v = x^2 + x$,where $v$ is in $m/s$ and $x$ is in $m$. Find its acceleration in $m/s^2$ when passing through the point $x = 2 \ m$.
Medium
View SolutionAmong the four graphs shown in the figure,there is only one graph for which the average velocity over the time interval $(0, T)$ can vanish for a suitably chosen $T$. Which one is it?
Difficult
View Solution$A$ rigid ball rolls without slipping on a surface shown below: Which one of the following is the most likely representation of the distance travelled by the ball versus time graph?
The figure shows the $x-t$ plot of a particle in one-dimensional motion. Three different equal intervals of time are shown. In which interval is the average speed greatest,and in which is it the least? Give the sign of average velocity for each interval.
Easy
View SolutionThe position-time graph of a particle moving along a straight line is shown,which is in the form of a semicircle starting from $t=2 \, s$ to $t=8 \, s$. Select the correct statement.
Medium
View SolutionVedclass Products
For Students
Vedclass Test Series
Mock tests in real JEE/NEET style with performance analysis. 5-day free trial.
Start Free TrialFor Teachers
Exam Paper Generator
Generate Set A/B/C/D exam papers from 7.5L+ questions in 2 minutes. 3 chapters free.
Try FreeFor Institutes
Online Exam Module
Live online exams with unlimited students, 360° analytics & white-label branding.
See Demo