
Medium
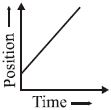
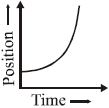
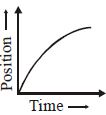
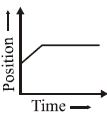
The velocity-time and acceleration-time graphs of a particle are given. Its position-time graph may be given as:
- A
- B
- C
- D
Explore More
Similar Questions
The instantaneous velocity of a body can be measured by:
Easy
View SolutionThe velocity-displacement graph of a particle is shown in the figure. The acceleration-displacement graph of the same particle is represented by:
The relation between velocity $v$ and displacement $x$ is $v = x^2$. Find the acceleration at $x = 3 \ m$.
Medium
View Solution$A$ particle of mass $m$ is constrained to move on the $x$-axis. $A$ force $F$ acts on the particle. $F$ always points toward the position labeled $E$. For example,when the particle is to the left of $E$,$F$ points to the right. The magnitude of $F$ is a constant $F_0$ except at point $E$ where it is zero. The system is horizontal. $F$ is the net force acting on the particle. The particle is displaced a distance $A$ towards the left from the equilibrium position $E$ and released from rest at $t = 0$. The velocity-time graph of the particle is:
For the given displacement-time graph,what will the corresponding velocity-time graph look like?
Difficult
View SolutionVedclass Products
For Students
Vedclass Test Series
Mock tests in real JEE/NEET style with performance analysis. 5-day free trial.
Start Free TrialFor Teachers
Exam Paper Generator
Generate Set A/B/C/D exam papers from 7.5L+ questions in 2 minutes. 3 chapters free.
Try FreeFor Institutes
Online Exam Module
Live online exams with unlimited students, 360° analytics & white-label branding.
See Demo