
A English
Mix Examples - Statistics and Probability Questions in English
Class 9 Mathematics · Statistics · Mix Examples - Statistics and Probability
140+
Questions
English
Language
100%
With Solutions
Showing 50 of 140 questions in English
51
MediumMCQ
Mean of $50$ observations was found to be $80.4$. But later on,it was discovered that $96$ was misread as $69$ at one place. Find the correct mean.
A
$100$
B
$90.90$
C
$86.74$
D
$80.94$
Solution
(D) Given that the mean of $50$ observations is $80.4$.
$\text{Sum of observations} = \text{Mean} \times \text{Number of observations} = 80.4 \times 50 = 4020$.
It was discovered that $96$ was misread as $69$. To find the correct sum,we subtract the incorrect value and add the correct value:
$\text{Correct sum} = 4020 - 69 + 96 = 4047$.
Now,calculate the correct mean:
$\text{Correct mean} = \frac{\text{Correct sum}}{\text{Number of observations}} = \frac{4047}{50} = 80.94$.
0 likes
View Solution52
MediumMCQ
Ten observations $6, 14, 15, 17, x+1, 2x-13, 30, 32, 34, 43$ are written in an ascending order. The median of the data is $24$. Find the value of $x$.
A
$20$
B
$40$
C
$60$
D
$80$
Solution
(A) The given observations are $6, 14, 15, 17, x+1, 2x-13, 30, 32, 34, 43$,which are already in ascending order.
Here,the number of observations $n = 10$,which is an even number.
For an even number of observations,the median is the average of the $(\frac{n}{2})^{th}$ term and the $(\frac{n}{2} + 1)^{th}$ term.
Median $= \frac{5^{th} \text{ term} + 6^{th} \text{ term}}{2}$.
Given the $5^{th}$ term is $(x+1)$ and the $6^{th}$ term is $(2x-13)$,we have:
Median $= \frac{(x+1) + (2x-13)}{2} = \frac{3x-12}{2}$.
Given that the median is $24$,we set up the equation:
$\frac{3x-12}{2} = 24$.
$3x - 12 = 48$.
$3x = 48 + 12 = 60$.
$x = \frac{60}{3} = 20$.
Thus,the value of $x$ is $20$.
0 likes
View Solution53
Medium
The points scored by a basketball team in a series of matches are as follows:
$17, 2, 7, 27, 25, 5, 14, 18, 10, 24, 48, 10, 8, 7, 10, 28$
Find the median and mode for the data.
$17, 2, 7, 27, 25, 5, 14, 18, 10, 24, 48, 10, 8, 7, 10, 28$
Find the median and mode for the data.
Solution
(C) First,arrange the given data in ascending order:
$2, 5, 7, 7, 8, 10, 10, 10, 14, 17, 18, 24, 25, 27, 28, 48$
To find the mode,identify the value that occurs most frequently. The value $10$ appears $3$ times,which is more than any other value.
Therefore,the mode of the data $= 10$.
To find the median,count the total number of observations,$n = 16$ (which is even).
The median is the average of the $(\frac{n}{2})^{th}$ value and the $(\frac{n}{2} + 1)^{th}$ value.
Median $= \text{Average of } 8^{th} \text{ value and } 9^{th} \text{ value}$.
The $8^{th}$ value is $10$ and the $9^{th}$ value is $14$.
Median $= \frac{10 + 14}{2} = \frac{24}{2} = 12$.
Hence,the median is $12$ and the mode is $10$.
0 likes
View Solution54
Medium
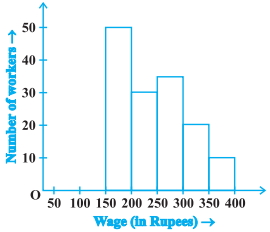
In the figure,there is a histogram depicting the daily wages of workers in a factory. Construct the frequency distribution table.
Solution
(N/A) To construct the frequency distribution table from the given histogram,we observe the height of each bar corresponding to its class interval on the x-axis.
| Class Interval (Daily Wages in Rupees) | Frequency (Number of Workers) |
|---|---|
| $150-200$ | $50$ |
| $200-250$ | $30$ |
| $250-300$ | $35$ |
| $300-350$ | $20$ |
| $350-400$ | $10$ |
| Total | $145$ |
0 likes
View Solution55
Medium
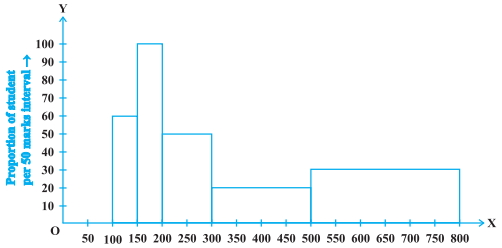
Following is the frequency distribution of total marks obtained by the students of different sections of Class $VIII.$
Draw a histogram for the distribution above.
| Marks | $100-150$ | $150-200$ | $200-300$ | $300-500$ | $500-800$ |
| Number of students | $60$ | $100$ | $100$ | $80$ | $180$ |
Solution
(N/A) In the given frequency distribution,the class intervals are not of equal width. Therefore,we must modify the lengths of the rectangles in the histogram so that the areas of the rectangles are proportional to the frequencies. The minimum class width is $50$. We calculate the adjusted length (frequency density) as: $\text{Length of rectangle} = \frac{\text{Minimum class width}}{\text{Class width}} \times \text{Frequency}$.
Now,we draw rectangles with lengths as given in the last column. The histogram of the data is shown below.
| Marks | Frequency | Width of the class | Length of the rectangle |
| $100-150$ | $60$ | $50$ | $\frac{50}{50} \times 60 = 60$ |
| $150-200$ | $100$ | $50$ | $\frac{50}{50} \times 100 = 100$ |
| $200-300$ | $100$ | $100$ | $\frac{50}{100} \times 100 = 50$ |
| $300-500$ | $80$ | $200$ | $\frac{50}{200} \times 80 = 20$ |
| $500-800$ | $180$ | $300$ | $\frac{50}{300} \times 180 = 30$ |
0 likes
View Solution56
Medium
Two sections of Class $IX$ having $30$ students each appeared for a mathematics olympiad. The marks obtained by them are shown below:
$\begin{array}{lllllllllllllll}46 & 31 & 74 & 68 & 42 & 54 & 14 & 61 & 83 & 48 & 37 & 26 & 8 & 64 & 57 \\ 93 & 72 & 53 & 59 & 38 & 16 & 88 & 75 & 56 & 46 & 66 & 45 & 61 & 54 & 27 \\ 27 & 44 & 63 & 58 & 43 & 81 & 64 & 67 & 36 & 49 & 50 & 76 & 38 & 47 & 55 \\ 77 & 62 & 53 & 40 & 71 & 60 & 58 & 45 & 42 & 34 & 46 & 40 & 59 & 42 & 29\end{array}$
Construct a grouped frequency distribution table for the data above using the classes $0-9, 10-19$,etc.,and hence find the number of students who secured more than $49$ marks.
Solution
(32) To construct the grouped frequency distribution,we count the number of students in each class interval:
To find the number of students who secured more than $49$ marks,we sum the frequencies of the classes $50-59, 60-69, 70-79, 80-89$,and $90-99$.
Number of students $= 12 + 10 + 6 + 3 + 1 = 32$.
| Class Interval | Frequency |
| $0-9$ | $1$ |
| $10-19$ | $2$ |
| $20-29$ | $4$ |
| $30-39$ | $6$ |
| $40-49$ | $15$ |
| $50-59$ | $12$ |
| $60-69$ | $10$ |
| $70-79$ | $6$ |
| $80-89$ | $3$ |
| $90-99$ | $1$ |
| Total | $60$ |
To find the number of students who secured more than $49$ marks,we sum the frequencies of the classes $50-59, 60-69, 70-79, 80-89$,and $90-99$.
Number of students $= 12 + 10 + 6 + 3 + 1 = 32$.
0 likes
View Solution57
Medium
The following are the marks (out of $100$) of $60$ students in mathematics:
$16, 13, 5, 80, 86, 7, 51, 48, 24, 56, 70, 19, 61, 17, 16, 36, 34, 42, 34, 35, 72, 55, 75, 31, 52, 28, 72, 97, 74, 45, 62, 68, 86, 35, 85, 36, 81, 75, 55, 26, 95, 31, 7, 78, 92, 62, 52, 56, 15, 63, 25, 36, 54, 44, 47, 27, 72, 17, 4, 30$
Construct a grouped frequency distribution table with a width of $10$ for each class,starting from $0-9$.
Solution
To construct the grouped frequency distribution table,we identify the class intervals starting from $0-9$ with a width of $10$. The intervals are $0-9, 10-19, 20-29, 30-39, 40-49, 50-59, 60-69, 70-79, 80-89, 90-99$.
By tallying the marks for each interval,we obtain the following frequency distribution table:
By tallying the marks for each interval,we obtain the following frequency distribution table:
| Class Intervals | Frequency |
| $0-9$ | $4$ |
| $10-19$ | $7$ |
| $20-29$ | $5$ |
| $30-39$ | $8$ |
| $40-49$ | $5$ |
| $50-59$ | $8$ |
| $60-69$ | $5$ |
| $70-79$ | $9$ |
| $80-89$ | $6$ |
| $90-99$ | $3$ |
0 likes
View Solution58
Medium
The following are the marks (out of $100$) of $60$ students in mathematics:
$16, 13, 5, 80, 86, 7, 51, 48, 24, 56, 70, 19, 61, 17, 16, 36, 34, 42, 34, 35, 72, 55, 75, 31, 52, 28, 72, 97, 74, 45, 62, 68, 86, 35, 85, 36, 81, 75, 55, 26, 95, 31, 7, 78, 92, 62, 52, 56, 15, 63, 25, 36, 54, 44, 47, 27, 72, 17, 4, 30$
Construct a grouped frequency distribution table with a class width of $10$,such that one of the classes is $10-20$ ($20$ not included).
Solution
(N/A) To construct the grouped frequency distribution table,we count the number of students falling into each class interval of width $10$. The data is distributed as follows:
| Class Intervals | Frequency |
| $0-10$ | $4$ |
| $10-20$ | $7$ |
| $20-30$ | $5$ |
| $30-40$ | $6$ |
| $40-50$ | $5$ |
| $50-60$ | $8$ |
| $60-70$ | $5$ |
| $70-80$ | $8$ |
| $80-90$ | $5$ |
| $90-100$ | $7$ |
0 likes
View Solution59
Medium
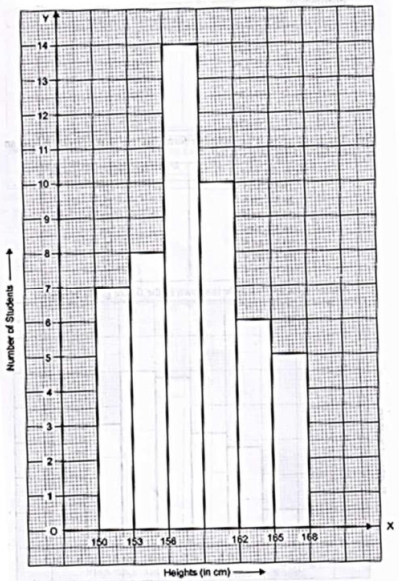
Draw a histogram of the following distribution:
| Heights (in $cm$) | Number of students |
|---|---|
| $150-153$ | $7$ |
| $153-156$ | $8$ |
| $156-159$ | $14$ |
| $159-162$ | $10$ |
| $162-165$ | $6$ |
| $165-168$ | $5$ |
Solution
(N/A) To draw a histogram for the given frequency distribution,follow these steps:
$1$. Represent the class intervals (Heights in $cm$) on the $x$-axis.
$2$. Represent the corresponding frequencies (Number of students) on the $y$-axis.
$3$. Since the class intervals are continuous,draw rectangular bars of equal width for each interval with heights corresponding to their respective frequencies.
$4$. The resulting histogram is shown in the image provided.
0 likes
View Solution60
Medium
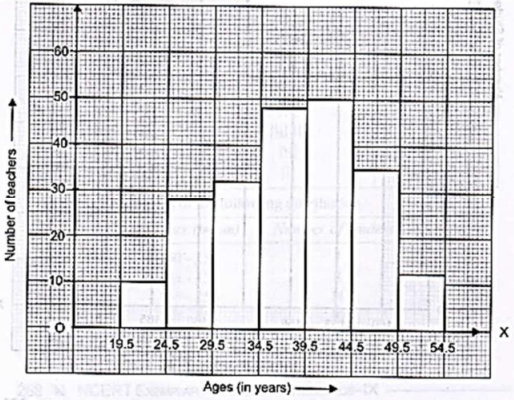
Draw a histogram to represent the following grouped frequency distribution:
| Ages (in years) | Number of teachers |
| $20-24$ | $10$ |
| $25-29$ | $28$ |
| $30-34$ | $32$ |
| $35-39$ | $48$ |
| $40-44$ | $50$ |
| $45-49$ | $35$ |
| $50-54$ | $12$ |
Solution
(N/A) The given frequency distribution is in inclusive form. To draw a histogram,we must first convert it into an exclusive (continuous) form. We do this by calculating the adjustment factor: $\frac{\text{Lower limit of next class} - \text{Upper limit of current class}}{2} = \frac{25-24}{2} = 0.5$. Subtract $0.5$ from each lower limit and add $0.5$ to each upper limit.
Now,plot the ages on the $x$-axis and the number of teachers on the $y$-axis to construct the histogram.
| Ages (in years) | Number of teachers |
| $19.5-24.5$ | $10$ |
| $24.5-29.5$ | $28$ |
| $29.5-34.5$ | $32$ |
| $34.5-39.5$ | $48$ |
| $39.5-44.5$ | $50$ |
| $44.5-49.5$ | $35$ |
| $49.5-54.5$ | $12$ |
Now,plot the ages on the $x$-axis and the number of teachers on the $y$-axis to construct the histogram.
0 likes
View Solution61
Medium
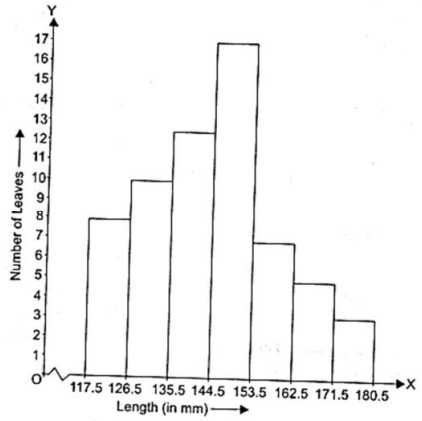
The lengths of $62$ leaves of a plant are measured in millimetres and the data is represented in the following table:
Draw a histogram to represent the data above.
| Length (in mm) | Number of leaves |
| $118-126$ | $8$ |
| $127-135$ | $10$ |
| $136-144$ | $12$ |
| $145-153$ | $17$ |
| $154-162$ | $7$ |
| $163-171$ | $5$ |
| $172-180$ | $3$ |
Draw a histogram to represent the data above.
Solution
(N/A) The given table is in inclusive form. To draw a histogram,we must first convert it into an exclusive form by finding the difference between the upper limit of one class and the lower limit of the next class. Here,the difference is $127 - 126 = 1$. We subtract $0.5$ from each lower limit and add $0.5$ to each upper limit.
$A$ histogram for this data is shown in the figure.
| Length (in mm) | Number of leaves |
| $117.5-126.5$ | $8$ |
| $126.5-135.5$ | $10$ |
| $135.5-144.5$ | $12$ |
| $144.5-153.5$ | $17$ |
| $153.5-162.5$ | $7$ |
| $162.5-171.5$ | $5$ |
| $171.5-180.5$ | $3$ |
$A$ histogram for this data is shown in the figure.
0 likes
View Solution62
Medium
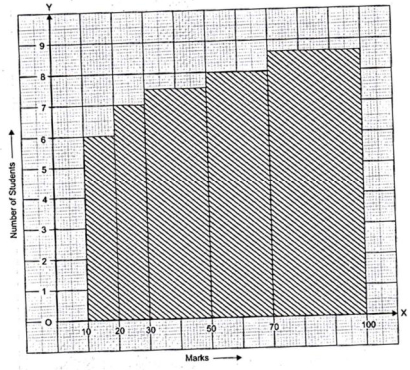
The marks obtained (out of $100$) by a class of $80$ students are given below:
Construct a histogram to represent the data above.
| Marks | Number of students |
| $10-20$ | $6$ |
| $20-30$ | $17$ |
| $30-50$ | $15$ |
| $50-70$ | $16$ |
| $70-100$ | $26$ |
Construct a histogram to represent the data above.
Solution
(N/A) Here,the class intervals are of unequal width. So,we shall compute the adjusted frequencies of each class. The minimum class size is $20-10=10$. The adjusted frequencies are computed by using the following formula:
$\text{Adjusted frequency} = \frac{\text{Minimum class size}}{\text{Class size}} \times \text{Frequency of the class}$
The adjusted frequencies are computed in the following table:
Now,we construct rectangles with class limits as bases and respective adjusted frequencies as heights.
$\text{Adjusted frequency} = \frac{\text{Minimum class size}}{\text{Class size}} \times \text{Frequency of the class}$
The adjusted frequencies are computed in the following table:
| Marks | Number of students (Frequency) | Adjusted Frequency |
| $10-20$ | $6$ | $\frac{10}{10} \times 6 = 6$ |
| $20-30$ | $17$ | $\frac{10}{10} \times 17 = 17$ |
| $30-50$ | $15$ | $\frac{10}{20} \times 15 = 7.5$ |
| $50-70$ | $16$ | $\frac{10}{20} \times 16 = 8$ |
| $70-100$ | $26$ | $\frac{10}{30} \times 26 \approx 8.67$ |
Now,we construct rectangles with class limits as bases and respective adjusted frequencies as heights.
0 likes
View Solution63
Medium
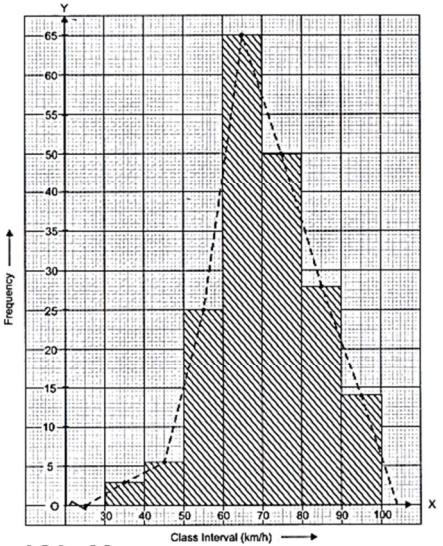
The following table shows a frequency distribution for the speed of cars passing through a particular spot on a highway:
Draw a histogram and a frequency polygon representing the data above.
| Class interval $(km/h)$ | Frequency |
|---|---|
| $30-40$ | $3$ |
| $40-50$ | $6$ |
| $50-60$ | $25$ |
| $60-70$ | $65$ |
| $70-80$ | $50$ |
| $80-90$ | $28$ |
| $90-100$ | $14$ |
Draw a histogram and a frequency polygon representing the data above.
Solution
(N/A) To draw the histogram and frequency polygon:
$1$. Represent the class intervals $(km/h)$ on the $x$-axis and the frequency on the $y$-axis.
$2$. Draw the histogram by constructing rectangles with widths equal to the class intervals and heights proportional to the frequencies.
$3$. To draw the frequency polygon,mark the midpoints of the top side of each rectangle of the histogram.
$4$. Join these midpoints with straight lines. To complete the polygon,join the first and last midpoints to the midpoints of the preceding and succeeding imaginary class intervals (with frequency $0$) on the $x$-axis.
0 likes
View Solution64
Medium
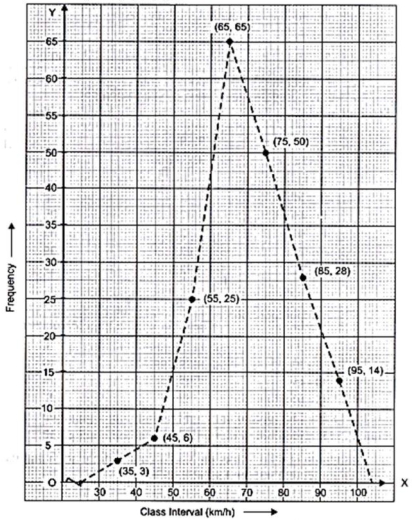
The following table shows a frequency distribution for the speed of cars passing through a particular spot on a highway:
Draw the frequency polygon representing the above data without drawing the histogram.
| Class interval $(km/h)$ | Frequency |
| $30-40$ | $3$ |
| $40-50$ | $6$ |
| $50-60$ | $25$ |
| $60-70$ | $65$ |
| $70-80$ | $50$ |
| $80-90$ | $28$ |
| $90-100$ | $14$ |
Draw the frequency polygon representing the above data without drawing the histogram.
Solution
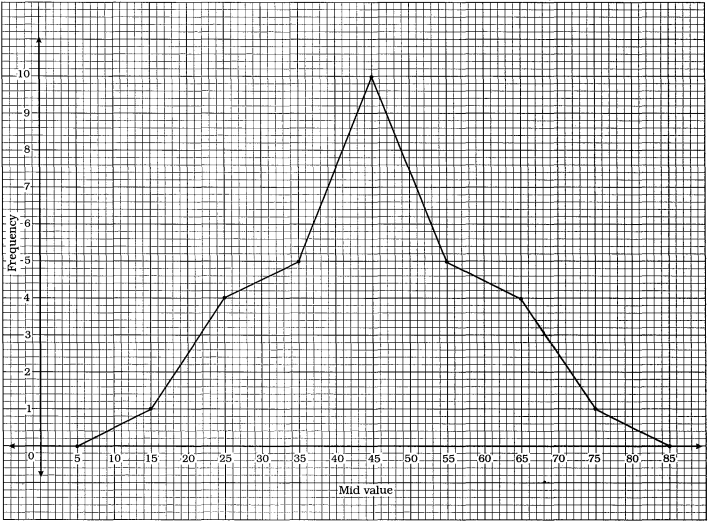
(N/A) To draw the frequency polygon without a histogram,we first calculate the class marks (mid-points) for each interval.
$1$. Plot the points $(35, 3), (45, 6), (55, 25), (65, 65), (75, 50), (85, 28),$ and $(95, 14)$ on a graph paper.
$2$. To close the polygon,include two additional class intervals with zero frequency: $20-30$ (mid-point $25$) and $100-110$ (mid-point $105$).
$3$. Join the points $(25, 0), (35, 3), (45, 6), (55, 25), (65, 65), (75, 50), (85, 28), (95, 14),$ and $(105, 0)$ with line segments to obtain the frequency polygon.
| Class interval $(km/h)$ | Class marks | Frequency |
| $30-40$ | $35$ | $3$ |
| $40-50$ | $45$ | $6$ |
| $50-60$ | $55$ | $25$ |
| $60-70$ | $65$ | $65$ |
| $70-80$ | $75$ | $50$ |
| $80-90$ | $85$ | $28$ |
| $90-100$ | $95$ | $14$ |
$1$. Plot the points $(35, 3), (45, 6), (55, 25), (65, 65), (75, 50), (85, 28),$ and $(95, 14)$ on a graph paper.
$2$. To close the polygon,include two additional class intervals with zero frequency: $20-30$ (mid-point $25$) and $100-110$ (mid-point $105$).
$3$. Join the points $(25, 0), (35, 3), (45, 6), (55, 25), (65, 65), (75, 50), (85, 28), (95, 14),$ and $(105, 0)$ with line segments to obtain the frequency polygon.
0 likes
View Solution65
Difficult
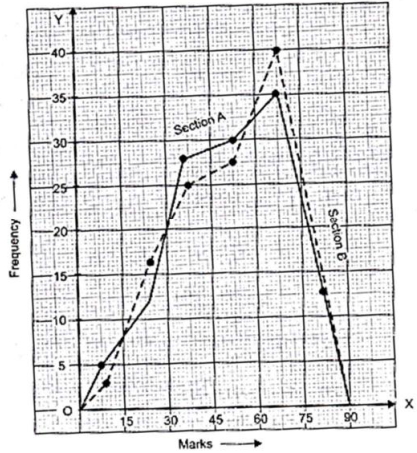
The following table gives the distribution of students of sections $A$ and $B$ of a class according to the marks obtained by them.
Represent the marks of the students of both the sections on the same graph by two frequency polygons. What do you observe?
| Marks | Section $A$ Frequency | Section $B$ Frequency |
|---|---|---|
| $0-15$ | $3$ | $3$ |
| $15-30$ | $12$ | $16$ |
| $30-45$ | $28$ | $25$ |
| $45-60$ | $30$ | $27$ |
| $60-75$ | $35$ | $40$ |
| $75-90$ | $13$ | $10$ |
Represent the marks of the students of both the sections on the same graph by two frequency polygons. What do you observe?
Solution
(N/A) To construct the frequency polygons,we first calculate the class marks (mid-points) for each interval:
$1$. For Section $A$,we plot the points $(7.5, 3), (22.5, 12), (37.5, 28), (52.5, 30), (67.5, 35), (82.5, 13)$ and join them with solid line segments.
$2$. For Section $B$,we plot the points $(7.5, 3), (22.5, 16), (37.5, 25), (52.5, 27), (67.5, 40), (82.5, 10)$ and join them with dotted line segments.
$3$. Observation: The frequency polygon for Section $B$ is higher in the range of $60-75$ marks compared to Section $A$,indicating that more students in Section $B$ achieved higher marks in that range. Overall,the performance of Section $B$ is better in the higher marks bracket.
| Marks | Class Mark | Section $A$ Frequency | Section $B$ Frequency |
|---|---|---|---|
| $0-15$ | $7.5$ | $3$ | $3$ |
| $15-30$ | $22.5$ | $12$ | $16$ |
| $30-45$ | $37.5$ | $28$ | $25$ |
| $45-60$ | $52.5$ | $30$ | $27$ |
| $60-75$ | $67.5$ | $35$ | $40$ |
| $75-90$ | $82.5$ | $13$ | $10$ |
$1$. For Section $A$,we plot the points $(7.5, 3), (22.5, 12), (37.5, 28), (52.5, 30), (67.5, 35), (82.5, 13)$ and join them with solid line segments.
$2$. For Section $B$,we plot the points $(7.5, 3), (22.5, 16), (37.5, 25), (52.5, 27), (67.5, 40), (82.5, 10)$ and join them with dotted line segments.
$3$. Observation: The frequency polygon for Section $B$ is higher in the range of $60-75$ marks compared to Section $A$,indicating that more students in Section $B$ achieved higher marks in that range. Overall,the performance of Section $B$ is better in the higher marks bracket.
0 likes
View Solution66
Difficult
The mean of the following distribution is $50$. Find the value of $a$ and hence the frequencies of $30$ and $70$.
| $x$ | $f$ |
| $10$ | $17$ |
| $30$ | $5a+3$ |
| $50$ | $32$ |
| $70$ | $7a-11$ |
| $90$ | $19$ |
Solution
(A) To find the mean,we use the formula $\bar{x} = \frac{\sum f_i x_i}{\sum f_i}$.
Constructing the frequency table:
Given $\bar{x} = 50$,we have:
$50 = \frac{640a + 2710}{12a + 60}$
$50(12a + 60) = 640a + 2710$
$600a + 3000 = 640a + 2710$
$3000 - 2710 = 640a - 600a$
$290 = 40a$
$a = \frac{290}{40} = 7.25$
Frequency of $30 = 5(7.25) + 3 = 36.25 + 3 = 39.25$
Frequency of $70 = 7(7.25) - 11 = 50.75 - 11 = 39.75$
Constructing the frequency table:
| $x_i$ | $f_i$ | $f_i x_i$ |
| $10$ | $17$ | $170$ |
| $30$ | $5a+3$ | $150a+90$ |
| $50$ | $32$ | $1600$ |
| $70$ | $7a-11$ | $490a-770$ |
| $90$ | $19$ | $1710$ |
| Total | $\sum f_i = 12a + 60$ | $\sum f_i x_i = 640a + 2710$ |
Given $\bar{x} = 50$,we have:
$50 = \frac{640a + 2710}{12a + 60}$
$50(12a + 60) = 640a + 2710$
$600a + 3000 = 640a + 2710$
$3000 - 2710 = 640a - 600a$
$290 = 40a$
$a = \frac{290}{40} = 7.25$
Frequency of $30 = 5(7.25) + 3 = 36.25 + 3 = 39.25$
Frequency of $70 = 7(7.25) - 11 = 50.75 - 11 = 39.75$
0 likes
View Solution67
MediumMCQ
The mean marks (out of $100$) of boys and girls in an examination are $70$ and $73$,respectively. If the mean marks of all the students in that examination is $71$,find the ratio of the number of boys to the number of girls.
A
$2 : 5$
B
$2 : 3$
C
$1 : 2$
D
$2 : 1$
Solution
(D) Let the number of boys be $n_1$ and the number of girls be $n_2$.
Using the formula for the combined mean:
$\bar{x} = \frac{n_1 \bar{x}_1 + n_2 \bar{x}_2}{n_1 + n_2}$
Given that $\bar{x}_1 = 70$,$\bar{x}_2 = 73$,and the combined mean $\bar{x} = 71$:
$71 = \frac{n_1 \times 70 + n_2 \times 73}{n_1 + n_2}$
Multiplying both sides by $(n_1 + n_2)$:
$71(n_1 + n_2) = 70n_1 + 73n_2$
$71n_1 + 71n_2 = 70n_1 + 73n_2$
Rearranging the terms to solve for the ratio:
$71n_1 - 70n_1 = 73n_2 - 71n_2$
$n_1 = 2n_2$
Therefore,the ratio of the number of boys to the number of girls is:
$\frac{n_1}{n_2} = \frac{2}{1}$
Thus,the required ratio is $2 : 1$.
0 likes
View Solution68
Difficult
$A$ total of $25$ patients admitted to a hospital are tested for blood sugar levels $(mg/dl)$ and the results obtained are as follows:
$\begin{array}{lllll} 87 & 71 & 83 & 67 & 85 \\ 77 & 69 & 76 & 65 & 85 \\ 85 & 54 & 70 & 68 & 80 \\ 73 & 78 & 68 & 85 & 73 \\ 81 & 78 & 81 & 77 & 75 \end{array}$
Find the mean,median,and mode $(mg/dl)$ of the above data.
$\begin{array}{lllll} 87 & 71 & 83 & 67 & 85 \\ 77 & 69 & 76 & 65 & 85 \\ 85 & 54 & 70 & 68 & 80 \\ 73 & 78 & 68 & 85 & 73 \\ 81 & 78 & 81 & 77 & 75 \end{array}$
Find the mean,median,and mode $(mg/dl)$ of the above data.
Solution
(N/A) Mean: Sum of all observations $= 87+71+83+67+85+77+69+76+65+85+85+54+70+68+80+73+78+68+85+73+81+78+81+77+75 = 1891$
Number of observations,$n = 25$
$\text{Mean } (\bar{x}) = \frac{\sum x_i}{n} = \frac{1891}{25} = 75.64$
Median: Arranging the observations in ascending order:
$54, 65, 67, 68, 68, 69, 70, 71, 73, 73, 75, 76, 77, 77, 78, 78, 80, 81, 81, 83, 85, 85, 85, 85, 87$
Since $n = 25$ (odd),the median is the $\left(\frac{n+1}{2}\right)^{th}$ term.
$\text{Median} = \left(\frac{25+1}{2}\right)^{th} = 13^{th}$ term.
The $13^{th}$ term in the ordered sequence is $77$.
Mode: The observation that occurs most frequently is the mode.
$85$ appears $4$ times,which is the highest frequency.
$\text{Mode} = 85$.
Final Answer: $\text{Mean} = 75.64, \text{Median} = 77, \text{Mode} = 85$.
0 likes
View Solution69
Easy
Give five examples of primary data that you can collect from your day-to-day life.
Solution
(N/A) Primary data is the data collected by the investigator herself or himself for a specific purpose. Five examples of primary data from day-to-day life are:
$1$. Number of students in your class who wear spectacles.
$2$. Number of family members in the houses of your neighborhood.
$3$. Number of hours you spend studying each day for a week.
$4$. Number of vehicles passing through your street in a specific hour.
$5$. Number of goals scored by your favorite football team in their last $5$ matches.
0 likes
View Solution70
Easy
Give five examples of secondary data that you can collect from your day-to-day life.
Solution
(N/A) Secondary data refers to information that has already been collected by someone else for a different purpose and is now being used by you. Five examples of secondary data from day-to-day life are:
$1$. Data regarding the population of your city obtained from the Census website.
$2$. Cricket statistics (e.g.,batting averages,strike rates) of players obtained from a sports website.
$3$. Weather reports and temperature records for the past week obtained from a newspaper or a weather app.
$4$. Nutritional information (e.g.,calories,fat content) printed on the labels of packaged food items.
$5$. Stock market prices or currency exchange rates obtained from a financial news channel or website.
0 likes
View Solution71
Easy
The marks obtained (out of $50$ marks) by $30$ students in a mathematics test are as given below:
$37, 22, 35, 42, 10, 16, 31, 22, 20, 27$
$27, 20, 31, 40, 35, 40, 27, 16, 47, 22$
$40, 22, 35, 20, 37, 20, 37, 47, 42, 31$
Represent this data in a frequency distribution table.
$37, 22, 35, 42, 10, 16, 31, 22, 20, 27$
$27, 20, 31, 40, 35, 40, 27, 16, 47, 22$
$40, 22, 35, 20, 37, 20, 37, 47, 42, 31$
Represent this data in a frequency distribution table.
Solution
To represent the data in a frequency distribution table,we count the occurrences of each mark obtained by the students.
| Marks | Number of students |
|---|---|
| $10$ | $1$ |
| $16$ | $2$ |
| $20$ | $4$ |
| $22$ | $4$ |
| $27$ | $3$ |
| $31$ | $3$ |
| $35$ | $3$ |
| $37$ | $3$ |
| $40$ | $3$ |
| $42$ | $2$ |
| $47$ | $2$ |
| Total | $30$ |
0 likes
View Solution72
Medium
The marks obtained (out of $100$ marks) by $50$ students in a mathematics test are as given below:
$\begin{array}{lrrrrrrrrr} 10, & 65, & 75, & 37, & 8, & 58, & 35, & 42, & 29, & 52 \\ 19, & 52, & 23, & 61, & 88, & 65, & 18, & 77, & 85, & 49, \\ 12, & 7, & 41, & 75, & 52, & 90, & 30, & 89, & 95, & 62, \\ 16, & 61, & 35, & 68, & 22, & 72, & 56, & 27, & 62, & 93, \\ 25, & 59, & 48, & 81, & 26, & 84, & 60, & 39, & 76, & 50 \end{array}$
Represent the data given above by a grouped frequency distribution table,taking the class intervals as $0-10, 10-20, \dots$ etc.
Solution
(N/A) To represent the data in a grouped frequency distribution table,we count the number of students falling into each class interval. Note that for an interval like $0-10$,the value $10$ is included in the next interval $10-20$.
| Marks (Class Intervals) | Number of Students (Frequency) |
| $0-10$ | $2$ |
| $10-20$ | $5$ |
| $20-30$ | $6$ |
| $30-40$ | $5$ |
| $40-50$ | $4$ |
| $50-60$ | $7$ |
| $60-70$ | $8$ |
| $70-80$ | $5$ |
| $80-90$ | $5$ |
| $90-100$ | $3$ |
| Total | $50$ |
0 likes
View Solution73
Easy
The number of books in different shelves of a library are as follows:
$37, 22, 24, 27, 28, 27, 20, 36, 21, 20,$
$29, 30, 29, 36, 30, 25, 27, 32, 24, 28,$
$34, 20, 25, 28, 30, 20, 35, 25, 27, 31$
Represent the data given above by a grouped frequency distribution table,taking the class intervals as $18-22, 22-26, 26-30, 30-34, 34-38$.
$37, 22, 24, 27, 28, 27, 20, 36, 21, 20,$
$29, 30, 29, 36, 30, 25, 27, 32, 24, 28,$
$34, 20, 25, 28, 30, 20, 35, 25, 27, 31$
Represent the data given above by a grouped frequency distribution table,taking the class intervals as $18-22, 22-26, 26-30, 30-34, 34-38$.
Solution
(N/A) To represent the data in a grouped frequency distribution table,we count the number of observations falling into each class interval. Note that the upper limit of a class is excluded from that class (e.g.,$18-22$ includes values from $18$ up to $21$).
$1$. For $18-22$: $20, 21, 20, 20, 20$ (Total: $5$)
$2$. For $22-26$: $22, 24, 25, 24, 25, 25$ (Total: $6$)
$3$. For $26-30$: $27, 28, 27, 27, 29, 29, 28, 28, 27$ (Total: $9$)
$4$. For $30-34$: $30, 30, 30, 32, 31$ (Total: $5$)
$5$. For $34-38$: $37, 36, 36, 34, 35$ (Total: $5$)
$1$. For $18-22$: $20, 21, 20, 20, 20$ (Total: $5$)
$2$. For $22-26$: $22, 24, 25, 24, 25, 25$ (Total: $6$)
$3$. For $26-30$: $27, 28, 27, 27, 29, 29, 28, 28, 27$ (Total: $9$)
$4$. For $30-34$: $30, 30, 30, 32, 31$ (Total: $5$)
$5$. For $34-38$: $37, 36, 36, 34, 35$ (Total: $5$)
| Number of books (Class) | No. of shelves (Frequency) |
|---|---|
| $18-22$ | $5$ |
| $22-26$ | $6$ |
| $26-30$ | $9$ |
| $30-34$ | $5$ |
| $34-38$ | $5$ |
0 likes
View Solution74
Medium
The marks obtained (out of $25$ marks) by $40$ students in an examination are as given below:
$\begin{array}{rrrrrrrrrr} 8, & 12, & 23, & 9, & 5, & 20, & 16, & 3, & 6, & 23 \\ 10, & 6, & 21, & 1, & 18, & 17, & 18, & 16, & 16, & 12, \\ 3, & 15, & 21, & 7, & 12, & 5, & 2, & 7, & 13, & 24, \\ 13, & 18, & 8, & 2, & 20, & 5, & 13, & 7, & 23, & 16 \end{array}$
Represent the data given above by a grouped frequency distribution table,taking the class intervals as $0-5, 5-10, \dots$ etc.
Solution
(N/A) To construct the grouped frequency distribution table,we count the number of students falling into each class interval. Note that the upper limit of each class is excluded (e.g.,$5$ is counted in $5-10$,not $0-5$).
$1$. $0-5$: $1, 2, 2, 3, 3$ (Frequency: $5$)
$2$. $5-10$: $5, 5, 5, 6, 6, 7, 7, 7, 8, 8, 9$ (Frequency: $11$)
$3$. $10-15$: $10, 12, 12, 12, 13, 13, 13$ (Frequency: $7$)
$4$. $15-20$: $15, 16, 16, 16, 16, 17, 18, 18, 18$ (Frequency: $9$)
$5$. $20-25$: $20, 20, 21, 21, 23, 23, 23, 24$ (Frequency: $8$)
Total frequency: $5 + 11 + 7 + 9 + 8 = 40$.
| Marks (Class Interval) | Number of Students (Frequency) |
| $0-5$ | $5$ |
| $5-10$ | $11$ |
| $10-15$ | $7$ |
| $15-20$ | $9$ |
| $20-25$ | $8$ |
0 likes
View Solution75
Medium
Three coins were tossed $30$ times simultaneously. Each time the number of heads occurring was noted down as follows:
$0, 1, 2, 2, 1, 2, 3, 1, 3, 0,$
$1, 3, 1, 1, 2, 2, 0, 1, 2, 1,$
$3, 0, 0, 1, 1, 2, 3, 2, 2, 0$
Prepare a frequency distribution table for the data given above.
$0, 1, 2, 2, 1, 2, 3, 1, 3, 0,$
$1, 3, 1, 1, 2, 2, 0, 1, 2, 1,$
$3, 0, 0, 1, 1, 2, 3, 2, 2, 0$
Prepare a frequency distribution table for the data given above.
Solution
(A) To prepare the frequency distribution table,we count the occurrences of each possible number of heads $(0, 1, 2, 3)$:
- Number of heads $0$: Occurs $6$ times.
- Number of heads $1$: Occurs $10$ times.
- Number of heads $2$: Occurs $9$ times.
- Number of heads $3$: Occurs $5$ times.
Total count = $6 + 10 + 9 + 5 = 30$.
- Number of heads $0$: Occurs $6$ times.
- Number of heads $1$: Occurs $10$ times.
- Number of heads $2$: Occurs $9$ times.
- Number of heads $3$: Occurs $5$ times.
Total count = $6 + 10 + 9 + 5 = 30$.
| Number of heads | Frequency (Number of tosses) |
|---|---|
| $0$ | $6$ |
| $1$ | $10$ |
| $2$ | $9$ |
| $3$ | $5$ |
| Total | $30$ |
0 likes
View Solution76
Medium
Below is the distribution of "more than" type of marks obtained by $50$ students in a $100$ marks examination. Prepare the grouped frequency distribution from that.
| Obtained marks | No. of Students |
| $0$ or more than $0$ | $50$ |
| $20$ or more than $20$ | $48$ |
| $40$ or more than $40$ | $40$ |
| $60$ or more than $60$ | $31$ |
| $80$ or more than $80$ | $10$ |
Solution
To prepare the grouped frequency distribution,we calculate the frequency for each class interval by subtracting the number of students in the higher range from the lower range.
$1$. For $0-20$: $50 - 48 = 2$
$2$. For $20-40$: $48 - 40 = 8$
$3$. For $40-60$: $40 - 31 = 9$
$4$. For $60-80$: $31 - 10 = 21$
$5$. For $80-100$: Since there are $10$ students who scored $80$ or more,and the total is $50$,the frequency for $80-100$ is $10$.
$1$. For $0-20$: $50 - 48 = 2$
$2$. For $20-40$: $48 - 40 = 8$
$3$. For $40-60$: $40 - 31 = 9$
$4$. For $60-80$: $31 - 10 = 21$
$5$. For $80-100$: Since there are $10$ students who scored $80$ or more,and the total is $50$,the frequency for $80-100$ is $10$.
| Marks obtained (Class) | $0-20$ | $20-40$ | $40-60$ | $60-80$ | $80-100$ |
| No. of students (Frequency) | $2$ | $8$ | $9$ | $21$ | $10$ |
0 likes
View Solution77
Medium
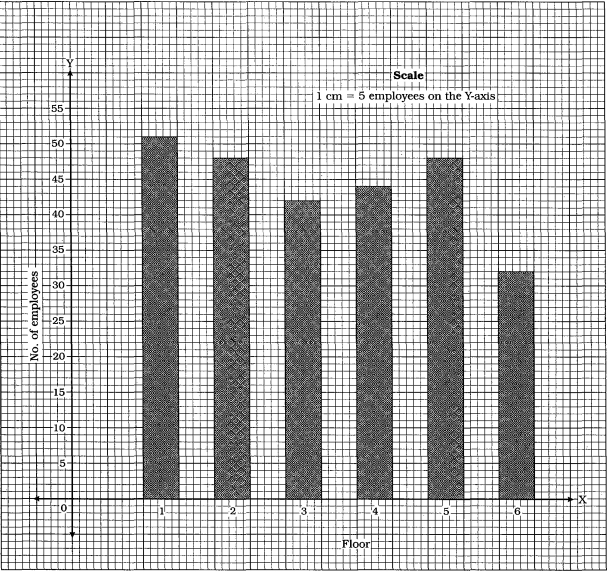
The following is the distribution of the number of employees working on different floors of the six-storey commercial complex:
Represent the information above by a bar graph.
| Floor | $1$ | $2$ | $3$ | $4$ | $5$ | $6$ |
| Number of employees | $51$ | $48$ | $42$ | $44$ | $48$ | $32$ |
Represent the information above by a bar graph.
Solution
(N/A) To represent the given data using a bar graph,follow these steps:
$1$. Draw two perpendicular axes,the $X$-axis (horizontal) and the $Y$-axis (vertical).
$2$. Along the $X$-axis,represent the 'Floor' numbers $(1, 2, 3, 4, 5, 6)$ at equal intervals.
$3$. Along the $Y$-axis,represent the 'Number of employees'. Choose a suitable scale,for example,$1 \text{ cm} = 5 \text{ employees}$.
$4$. Draw bars of equal width for each floor,with heights corresponding to the number of employees given in the table.
- For Floor $1$,draw a bar of height $51$ units.
- For Floor $2$,draw a bar of height $48$ units.
- For Floor $3$,draw a bar of height $42$ units.
- For Floor $4$,draw a bar of height $44$ units.
- For Floor $5$,draw a bar of height $48$ units.
- For Floor $6$,draw a bar of height $32$ units.
0 likes
View Solution78
Medium
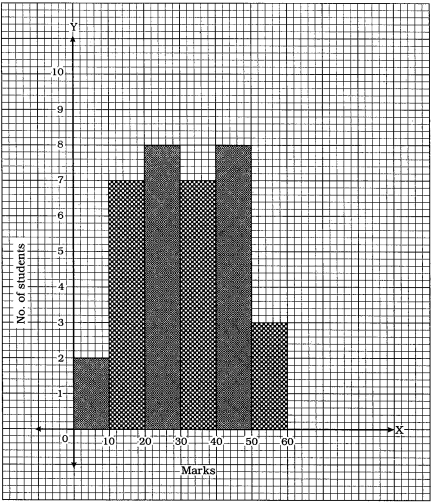
The frequency distribution of the marks scored by $35$ students in a $60$ marks test is as below:
Represent the data by a histogram.
| Marks scored | No. of students |
| $0-10$ | $2$ |
| $10-20$ | $7$ |
| $20-30$ | $8$ |
| $30-40$ | $7$ |
| $40-50$ | $8$ |
| $50-60$ | $3$ |
Represent the data by a histogram.
Solution
(N/A) To represent the given data by a histogram,follow these steps:
$1$. Draw two perpendicular axes,the $X$-axis and the $Y$-axis.
$2$. Along the $X$-axis,represent the 'Marks scored' with a suitable scale (e.g.,$1$ cm = $10$ units).
$3$. Along the $Y$-axis,represent the 'No. of students' with a suitable scale (e.g.,$1$ cm = $1$ unit).
$4$. Construct rectangular bars for each class interval such that the width of the bar is equal to the class size and the height is proportional to the frequency of that class.
$5$. Since the class intervals are continuous,the bars will be adjacent to each other.
The resulting histogram shows the distribution of students across different mark ranges as depicted in the provided graph.
0 likes
View Solution79
Medium
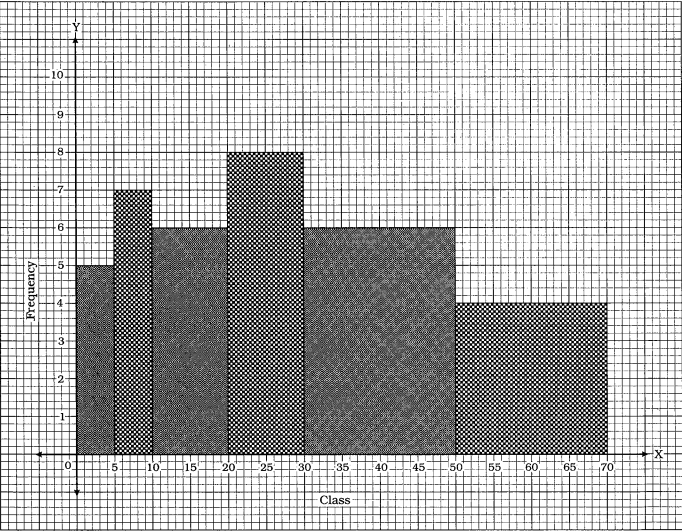
Represent the following data by means of a histogram:
| Class | $0-5$ | $5-10$ | $10-20$ | $20-30$ | $30-50$ | $50-70$ |
|---|---|---|---|---|---|---|
| Frequency | $5$ | $7$ | $12$ | $16$ | $24$ | $16$ |
Solution
Here,the class intervals have unequal widths. Therefore,we must first compute the adjusted frequencies for each class. The minimum class size is $5 - 0 = 5$. The adjusted frequencies are calculated using the following formula:
$\text{Adjusted frequency of a class} = \frac{\text{Frequency of the class}}{\text{Class size}} \times \text{Minimum class size}$
The adjusted frequencies are calculated in the table below:
Using these adjusted frequencies,we plot the histogram where the $x$-axis represents the class intervals and the $y$-axis represents the adjusted frequencies (heights of the rectangles).
$\text{Adjusted frequency of a class} = \frac{\text{Frequency of the class}}{\text{Class size}} \times \text{Minimum class size}$
The adjusted frequencies are calculated in the table below:
| Class | Frequency | Class size | Adjusted frequency (Height of rectangle) |
|---|---|---|---|
| $0-5$ | $5$ | $5$ | $(5/5) \times 5 = 5$ |
| $5-10$ | $7$ | $5$ | $(7/5) \times 5 = 7$ |
| $10-20$ | $12$ | $10$ | $(12/10) \times 5 = 6$ |
| $20-30$ | $16$ | $10$ | $(16/10) \times 5 = 8$ |
| $30-50$ | $24$ | $20$ | $(24/20) \times 5 = 6$ |
| $50-70$ | $16$ | $20$ | $(16/20) \times 5 = 4$ |
Using these adjusted frequencies,we plot the histogram where the $x$-axis represents the class intervals and the $y$-axis represents the adjusted frequencies (heights of the rectangles).
0 likes
View Solution80
Medium
For the following data,draw a frequency polygon:
| Class | $10-20$ | $20-30$ | $30-40$ | $40-50$ | $50-60$ | $60-70$ | $70-80$ |
| Frequency | $1$ | $4$ | $5$ | $10$ | $5$ | $4$ | $1$ |
Solution
(N/A) To draw a frequency polygon,we first calculate the class marks (mid-values) for each class interval.
To close the polygon,we include two imaginary classes: $0-10$ with mid-value $5$ and frequency $0$,and $80-90$ with mid-value $85$ and frequency $0$. Plot these points $(5, 0), (15, 1), (25, 4), (35, 5), (45, 10), (55, 5), (65, 4), (75, 1), (85, 0)$ on a graph and join them with line segments.
| Class | Mid-value | Frequency |
| $10-20$ | $15$ | $1$ |
| $20-30$ | $25$ | $4$ |
| $30-40$ | $35$ | $5$ |
| $40-50$ | $45$ | $10$ |
| $50-60$ | $55$ | $5$ |
| $60-70$ | $65$ | $4$ |
| $70-80$ | $75$ | $1$ |
To close the polygon,we include two imaginary classes: $0-10$ with mid-value $5$ and frequency $0$,and $80-90$ with mid-value $85$ and frequency $0$. Plot these points $(5, 0), (15, 1), (25, 4), (35, 5), (45, 10), (55, 5), (65, 4), (75, 1), (85, 0)$ on a graph and join them with line segments.
0 likes
View Solution81
Medium
Represent the following data by a bar graph:
| Name of student | Kavya | Ariv | Ahaan | Arya | Arushi |
| Marks scored | $90$ | $80$ | $50$ | $60$ | $40$ |
Solution
(N/A) To represent the data using a bar graph,follow these steps:
$1$. Draw two perpendicular axes: the horizontal axis ($x$-axis) and the vertical axis ($y$-axis).
$2$. Along the $x$-axis,mark the names of the students (Kavya,Ariv,Ahaan,Arya,Arushi) at equal intervals.
$3$. Along the $y$-axis,choose a suitable scale to represent the marks scored. For example,$1 \text{ unit} = 10 \text{ marks}$.
$4$. Draw bars of equal width for each student,with heights corresponding to their respective marks:
- Kavya: $90$
- Ariv: $80$
- Ahaan: $50$
- Arya: $60$
- Arushi: $40$
$5$. Ensure there is equal spacing between the bars.
0 likes
View Solution82
Medium
Represent the following data by a bar graph:
| Score | Frequency |
|---|---|
| $1$ | $15$ |
| $2$ | $13$ |
| $3$ | $20$ |
| $4$ | $17$ |
| $5$ | $20$ |
| $6$ | $15$ |
Solution
(N/A) To represent the given data using a bar graph,follow these steps:
$1$. Draw two perpendicular axes on a graph paper: a horizontal axis ($X$-axis) and a vertical axis ($Y$-axis).
$2$. Along the $X$-axis,represent the 'Score' values $(1, 2, 3, 4, 5, 6)$ at equal intervals.
$3$. Along the $Y$-axis,choose a suitable scale to represent the 'Frequency'. For example,$1 \text{ unit} = 2 \text{ units of frequency}$.
$4$. Draw rectangular bars of equal width for each score,where the height of the bar corresponds to its respective frequency:
- For score $1$,draw a bar of height $15$.
- For score $2$,draw a bar of height $13$.
- For score $3$,draw a bar of height $20$.
- For score $4$,draw a bar of height $17$.
- For score $5$,draw a bar of height $20$.
- For score $6$,draw a bar of height $15$.
$5$. Ensure there is a uniform gap between the bars.
0 likes
View Solution83
Medium
Draw a histogram for the data given below:
| Class | $0-6$ | $6-12$ | $12-18$ | $18-24$ | $24-30$ | $30-36$ |
| Frequency | $7$ | $10$ | $12$ | $15$ | $10$ | $6$ |
Solution
(N/A) To draw a histogram for the given frequency distribution,follow these steps:
$1$. Draw two perpendicular axes on a graph paper. Label the horizontal axis ($x$-axis) as 'Class' and the vertical axis ($y$-axis) as 'Frequency'.
$2$. Mark the class intervals on the $x$-axis at equal intervals $(0, 6, 12, 18, 24, 30, 36)$.
$3$. Choose an appropriate scale for the $y$-axis (e.g.,$1 \text{ cm} = 2 \text{ units}$).
$4$. For each class interval,draw a rectangle whose width is equal to the class size $(6)$ and height is equal to the corresponding frequency.
- For class $0-6$,height is $7$.
- For class $6-12$,height is $10$.
- For class $12-18$,height is $12$.
- For class $18-24$,height is $15$.
- For class $24-30$,height is $10$.
- For class $30-36$,height is $6$.
$5$. Since the class intervals are continuous,the rectangles will be adjacent to each other,forming the histogram.
0 likes
View Solution84
Easy
Draw a histogram for the data given below:
| Class | $0-10$ | $10-20$ | $20-30$ | $30-40$ | $40-50$ | $50-60$ |
| Frequency | $5$ | $7$ | $12$ | $9$ | $13$ | $5$ |
Solution
(N/A) To draw a histogram for the given frequency distribution,follow these steps:
$1$. Draw two perpendicular axes on a graph paper: the horizontal axis ($X$-axis) and the vertical axis ($Y$-axis).
$2$. Along the $X$-axis,represent the class intervals $(0-10, 10-20, 20-30, 30-40, 40-50, 50-60)$. Choose a suitable scale,e.g.,$1 \text{ cm} = 10 \text{ units}$.
$3$. Along the $Y$-axis,represent the frequencies $(5, 7, 12, 9, 13, 5)$. Choose a suitable scale,e.g.,$1 \text{ cm} = 2 \text{ units}$.
$4$. Construct rectangular bars for each class interval such that the width of the bar is equal to the class size and the height is proportional to the frequency.
$5$. Since the class intervals are continuous,the bars will be adjacent to each other with no gaps.
1 likes
View Solution85
Medium
Draw a histogram for the following frequency distribution with unequal class length:
| Class | $0-10$ | $10-20$ | $20-40$ | $40-70$ | $70-100$ |
| Frequency | $15$ | $13$ | $28$ | $36$ | $27$ |
Solution
(N/A) To draw a histogram for a frequency distribution with unequal class lengths,we must calculate the adjusted frequency (height of the rectangle) for each class.
$1$. The formula for adjusted frequency is: $\text{Adjusted Frequency} = \frac{\text{Minimum class size}}{\text{Class size}} \times \text{Frequency}$.
$2$. The minimum class size is $10$ (from $0-10$ and $10-20$).
Calculation table:
Finally,plot the class intervals on the $x$-axis and the adjusted frequencies on the $y$-axis to draw the histogram.
$1$. The formula for adjusted frequency is: $\text{Adjusted Frequency} = \frac{\text{Minimum class size}}{\text{Class size}} \times \text{Frequency}$.
$2$. The minimum class size is $10$ (from $0-10$ and $10-20$).
Calculation table:
| Class | Frequency | Class Size | Adjusted Frequency |
| $0-10$ | $15$ | $10$ | $(10/10) \times 15 = 15$ |
| $10-20$ | $13$ | $10$ | $(10/10) \times 13 = 13$ |
| $20-40$ | $28$ | $20$ | $(10/20) \times 28 = 14$ |
| $40-70$ | $36$ | $30$ | $(10/30) \times 36 = 12$ |
| $70-100$ | $27$ | $30$ | $(10/30) \times 27 = 9$ |
Finally,plot the class intervals on the $x$-axis and the adjusted frequencies on the $y$-axis to draw the histogram.
1 likes
View Solution86
Medium
Draw a histogram for the following frequency distribution with unequal class length:
| Class | $0-5$ | $5-10$ | $10-20$ | $20-30$ | $30-50$ | $50-70$ | $70-100$ |
| Frequency | $6$ | $8$ | $14$ | $16$ | $24$ | $20$ | $30$ |
Solution
(N/A) For a histogram with unequal class intervals,the height of the rectangles must be proportional to the frequency density,not just the frequency.
$1$. Calculate the class width $(w)$ for each class.
$2$. Calculate the frequency density = $\frac{\text{Frequency}}{\text{Class width}}$.
| Class | Frequency $(f)$ | Width $(w)$ | Frequency Density $(f/w)$ |
| :--- | :--- | :--- | :--- |
| $0-5$ | $6$ | $5$ | $1.2$ |
| $5-10$ | $8$ | $5$ | $1.6$ |
| $10-20$ | $14$ | $10$ | $1.4$ |
| $20-30$ | $16$ | $10$ | $1.6$ |
| $30-50$ | $24$ | $20$ | $1.2$ |
| $50-70$ | $20$ | $20$ | $1.0$ |
| $70-100$ | $30$ | $30$ | $1.0$ |
$3$. Plot the class intervals on the $x$-axis and the frequency density on the $y$-axis to draw the histogram.
0 likes
View Solution87
Medium
Draw a frequency polygon for the following frequency distribution:
| Class | $20-30$ | $30-40$ | $40-50$ | $50-60$ | $60-70$ | $70-80$ |
|---|---|---|---|---|---|---|
| Frequency | $5$ | $7$ | $12$ | $7$ | $10$ | $9$ |
Solution
(N/A) To draw a frequency polygon,follow these steps:
$1$. Find the class marks (mid-points) for each class interval using the formula: $\text{Class mark} = \frac{\text{Lower limit} + \text{Upper limit}}{2}$.
$2$. Calculate the class marks:
- For $20-30$: $\frac{20+30}{2} = 25$
- For $30-40$: $\frac{30+40}{2} = 35$
- For $40-50$: $\frac{40+50}{2} = 45$
- For $50-60$: $\frac{50+60}{2} = 55$
- For $60-70$: $\frac{60+70}{2} = 65$
- For $70-80$: $\frac{70+80}{2} = 75$
$3$. To close the polygon,include two additional classes with frequency $0$: $10-20$ (mid-point $15$) and $80-90$ (mid-point $85$).
$4$. Plot the points $(15, 0), (25, 5), (35, 7), (45, 12), (55, 7), (65, 10), (75, 9), (85, 0)$ on a graph paper where the $x$-axis represents the class marks and the $y$-axis represents the frequency.
$5$. Join these points with straight line segments to form the frequency polygon.
0 likes
View Solution88
Medium
Draw a frequency polygon for the following frequency distribution:
| Class | $0-10$ | $10-20$ | $20-30$ | $30-40$ | $40-50$ |
|---|---|---|---|---|---|
| Frequency | $6$ | $4$ | $10$ | $12$ | $5$ |
Solution
(N/A) To draw a frequency polygon, follow these steps:
$1$. Calculate the class marks (mid-points) for each class interval using the formula: $\text{Class mark} = \frac{\text{Lower limit} + \text{Upper limit}}{2}$.
- For $0-10$: $\frac{0+10}{2} = 5$
- For $10-20$: $\frac{10+20}{2} = 15$
- For $20-30$: $\frac{20+30}{2} = 25$
- For $30-40$: $\frac{30+40}{2} = 35$
- For $40-50$: $\frac{40+50}{2} = 45$
$2$. Create a table of (class mark, frequency) coordinates: $(5, 6), (15, 4), (25, 10), (35, 12), (45, 5)$.
$3$. To close the polygon, include two additional classes with frequency $0$: one before the first class $(-10-0)$ with class mark $-5$ and one after the last class $(50-60)$ with class mark $55$.
$4$. Plot these points on a graph paper where the $x$-axis represents the class marks and the $y$-axis represents the frequencies.
$5$. Join the points with straight line segments to form the frequency polygon.
0 likes
View Solution89
EasyMCQ
Find the mean of the observations $15, 22, 18, 27, 31, 21, 14, 36, 25$ and $34$.
A
$21.3$
B
$24.3$
C
$26.1$
D
$23.5$
Solution
(B) The mean $\bar{x}$ is calculated using the formula $\bar{x} = \frac{\sum x_i}{n}$,where $n$ is the total number of observations.
Here,the number of observations $n = 10$.
The sum of the observations is $15 + 22 + 18 + 27 + 31 + 21 + 14 + 36 + 25 + 34 = 243$.
Therefore,the mean $\bar{x} = \frac{243}{10} = 24.3$.
Here,the number of observations $n = 10$.
The sum of the observations is $15 + 22 + 18 + 27 + 31 + 21 + 14 + 36 + 25 + 34 = 243$.
Therefore,the mean $\bar{x} = \frac{243}{10} = 24.3$.
0 likes
View Solution90
MediumMCQ
The information regarding the marks scored by $30$ students in a $50$ marks test is given below:
Find the mean of the data.
| Marks $(x_{i})$ | $15$ | $22$ | $28$ | $31$ | $35$ | $40$ | $44$ | $46$ |
| Number of students $(f_{i})$ | $2$ | $3$ | $5$ | $6$ | $6$ | $4$ | $3$ | $1$ |
Find the mean of the data.
A
$33.2$
B
$23.33$
C
$32.33$
D
$31.33$
Solution
(C) To find the mean,we use the formula $\bar{x} = \frac{\sum f_{i} x_{i}}{\sum f_{i}}$.
First,calculate the product $f_{i} x_{i}$ for each entry:
Sum of $f_{i} = 30$.
Sum of $f_{i} x_{i} = 30 + 66 + 140 + 186 + 210 + 160 + 132 + 46 = 970$.
Mean $\bar{x} = \frac{970}{30} = 32.33$.
First,calculate the product $f_{i} x_{i}$ for each entry:
| Marks $(x_{i})$ | Students $(f_{i})$ | $f_{i} x_{i}$ |
| $15$ | $2$ | $30$ |
| $22$ | $3$ | $66$ |
| $28$ | $5$ | $140$ |
| $31$ | $6$ | $186$ |
| $35$ | $6$ | $210$ |
| $40$ | $4$ | $160$ |
| $44$ | $3$ | $132$ |
| $46$ | $1$ | $46$ |
| Total | $30$ | $970$ |
Sum of $f_{i} = 30$.
Sum of $f_{i} x_{i} = 30 + 66 + 140 + 186 + 210 + 160 + 132 + 46 = 970$.
Mean $\bar{x} = \frac{970}{30} = 32.33$.
0 likes
View Solution91
MediumMCQ
The weights (in $kg$) of $11$ students are given below:
$37, 42, 40, 39, 41, 35, 37, 36, 40, 40, 42$
Find the median of the data.
$37, 42, 40, 39, 41, 35, 37, 36, 40, 40, 42$
Find the median of the data.
A
$35$
B
$42$
C
$37$
D
$40$
Solution
(D) To find the median,first arrange the observations in ascending order:
$35, 36, 37, 37, 39, 40, 40, 40, 41, 42, 42$
Here,the total number of observations $n = 11$,which is an odd number.
The formula for the median when $n$ is odd is the value of the $\left(\frac{n+1}{2}\right)$-th observation.
Median $= \left(\frac{11+1}{2}\right)$-th observation
$= \left(\frac{12}{2}\right)$-th observation
$= 6$-th observation.
Counting the $6$-th value in the ordered list: $35(1), 36(2), 37(3), 37(4), 39(5), 40(6)$.
Thus,the median of the data is $40 \ kg$.
0 likes
View Solution92
MediumMCQ
Find the median of the observation: $62, 67, 82, 71, 75, 77, 63, 91$.
A
$73$
B
$71$
C
$75$
D
$67$
Solution
(A) Arranging the observations in ascending order,we get:
$62, 63, 67, 71, 75, 77, 82, 91$
Here,the total number of observations $n = 8$,which is an even number.
Therefore,the median $M$ is the average of the $\left(\frac{n}{2}\right)^{\text{th}}$ and $\left(\frac{n}{2} + 1\right)^{\text{th}}$ observations.
$M = \frac{\left(\frac{8}{2}\right)^{\text{th}} \text{ observation} + \left(\frac{8}{2} + 1\right)^{\text{th}} \text{ observation}}{2}$
$M = \frac{4^{\text{th}} \text{ observation} + 5^{\text{th}} \text{ observation}}{2}$
From the ordered list,the $4^{\text{th}}$ observation is $71$ and the $5^{\text{th}}$ observation is $75$.
$M = \frac{71 + 75}{2} = \frac{146}{2} = 73$
Thus,the median of the given data is $73$.
0 likes
View Solution93
EasyMCQ
Find the mode of the following observations: $14, 25, 28, 29, 17, 14, 19, 22, 14, 30, 16, 28, 14, 25$.
A
$14$
B
$17$
C
$16$
D
$19$
Solution
(A) The mode is defined as the observation that occurs most frequently in a data set.
By observing the given data: $14, 25, 28, 29, 17, 14, 19, 22, 14, 30, 16, 28, 14, 25$.
We count the frequency of each observation:
$14$ appears $4$ times.
$25$ appears $2$ times.
$28$ appears $2$ times.
$29, 17, 19, 22, 30, 16$ each appear $1$ time.
Since $14$ has the highest frequency,the mode of the data is $14$.
0 likes
View Solution94
Medium
Find the mean,the median,and the mode of the observations:
$48, 41, 36, 35, 41, 37, 39, 52, 41, 48$
$48, 41, 36, 35, 41, 37, 39, 52, 41, 48$
Solution
(A) Step $1$: To find the mean,sum all observations and divide by the total count.
Sum $= 48 + 41 + 36 + 35 + 41 + 37 + 39 + 52 + 41 + 48 = 418$.
Total number of observations $n = 10$.
Mean $= \frac{418}{10} = 41.8$.
Step $2$: To find the median,arrange the data in ascending order:
$35, 36, 37, 39, 41, 41, 41, 48, 48, 52$.
Since $n = 10$ (even),the median is the average of the $5^{th}$ and $6^{th}$ terms.
Median $= \frac{41 + 41}{2} = 41$.
Step $3$: To find the mode,identify the observation that occurs most frequently.
The value $41$ appears $3$ times,which is more than any other value.
Mode $= 41$.
0 likes
View Solution95
Medium
The heights (in $cm$) of $12$ students are as follows:
$159, 148, 138, 150, 165, 166, 145, 152, 155, 160, 147, 151$
Find the mean,the median,and the mode.
$159, 148, 138, 150, 165, 166, 145, 152, 155, 160, 147, 151$
Find the mean,the median,and the mode.
Solution
(N/A) $1$. Mean: The mean is the sum of all observations divided by the total number of observations.
Sum $= 159 + 148 + 138 + 150 + 165 + 166 + 145 + 152 + 155 + 160 + 147 + 151 = 1836$.
Mean $= 1836 / 12 = 153 \ cm$.
$2$. Median: First,arrange the data in ascending order:
$138, 145, 147, 148, 150, 151, 152, 155, 159, 160, 165, 166$.
Since the number of observations $(n = 12)$ is even,the median is the average of the $6^{th}$ and $7^{th}$ terms.
Median $= (151 + 152) / 2 = 303 / 2 = 151.5 \ cm$.
$3$. Mode: The mode is the value that appears most frequently. In this dataset,every value appears exactly once,so there is no mode.
0 likes
View Solution96
MediumMCQ
Find the mean of the following frequency distribution:
| Score $(x)$ | $1$ | $2$ | $3$ | $4$ | $5$ | $6$ | $7$ |
| Frequency $(f)$ | $5$ | $9$ | $12$ | $17$ | $14$ | $10$ | $6$ |
A
$5$
B
$10.5$
C
$17$
D
$4.10$
Solution
(D) To find the mean $(\bar{x})$ of a frequency distribution,we use the formula: $(\bar{x}) = \frac{\sum f_i x_i}{\sum f_i}$.
Step $1$: Calculate the sum of frequencies $(sum f_i)$:
$sum f_i = 5 + 9 + 12 + 17 + 14 + 10 + 6 = 73$.
Step $2$: Calculate the sum of the products of scores and frequencies $(sum f_i x_i)$:
$f_1 x_1 = 1 \times 5 = 5$
$f_2 x_2 = 2 \times 9 = 18$
$f_3 x_3 = 3 \times 12 = 36$
$f_4 x_4 = 4 \times 17 = 68$
$f_5 x_5 = 5 \times 14 = 70$
$f_6 x_6 = 6 \times 10 = 60$
$f_7 x_7 = 7 \times 6 = 42$
$sum f_i x_i = 5 + 18 + 36 + 68 + 70 + 60 + 42 = 299$.
Step $3$: Calculate the mean:
$(\bar{x})= \frac{299}{73} \approx 4.0958... \approx 4.10$.
0 likes
View Solution97
Medium
Find the mean,the median,and the mode of the observations:
$33, 92, 55, 90, 35, 77, 58, 41, 80, 64, 46$
$33, 92, 55, 90, 35, 77, 58, 41, 80, 64, 46$
Solution
(N/A) $1$. To find the mean,sum all observations and divide by the total count:
Sum $= 33 + 92 + 55 + 90 + 35 + 77 + 58 + 41 + 80 + 64 + 46 = 671$
Total number of observations $(n) = 11$
Mean $= \frac{671}{11} = 61$
$2$. To find the median,arrange the data in ascending order:
$33, 35, 41, 46, 55, 58, 64, 77, 80, 90, 92$
Since $n = 11$ (odd),the median is the value at the $\frac{n+1}{2}$-th position:
Median $= \frac{11+1}{2} = 6$-th position $= 58$
$3$. To find the mode,identify the value that appears most frequently:
Since every observation appears exactly once,there is no mode.
0 likes
View Solution98
MediumMCQ
Find the mean and the median of the observations: $72, 15, 28, 31, 32, 51, 44, 43$ and $62$.
A
Mean $= 42, \text{Median} = 43$
B
Mean $= 43, \text{Median} = 42$
C
Mean $= 42, \text{Median} = 42$
D
Mean $= 43, \text{Median} = 43$
Solution
(A) Step $1$: To find the mean, sum all the observations and divide by the total number of observations.
Sum $= 72 + 15 + 28 + 31 + 32 + 51 + 44 + 43 + 62 = 378$.
Total number of observations $(n) = 9$.
Mean $= \frac{378}{9} = 42$.
Step $2$: To find the median, arrange the observations in ascending order.
Ordered data: $15, 28, 31, 32, 43, 44, 51, 62, 72$.
Since $n = 9$ (which is odd), the median is the value at the $\frac{n+1}{2}$-th position.
Median $= \frac{9+1}{2} = 5\text{-th position}$.
The $5\text{-th}$ value in the ordered list is $43$.
Therefore, Mean $= 42$ and Median $= 43$.
0 likes
View Solution99
MediumMCQ
The mean of $10$ observations is $48$. If each observation is divided by $3$,what will be the new mean?
A
$32$
B
$13$
C
$16$
D
$20$
Solution
(C) Let the $10$ observations be $x_1, x_2, ..., x_{10}$.
The mean of these observations is given by $\bar{x} = \frac{\sum_{i=1}^{10} x_i}{10} = 48$.
Therefore,the sum of the observations is $\sum_{i=1}^{10} x_i = 48 \times 10 = 480$.
If each observation is divided by $3$,the new observations are $\frac{x_1}{3}, \frac{x_2}{3}, ..., \frac{x_{10}}{3}$.
The new mean $\bar{x}'$ is given by $\bar{x}' = \frac{\sum_{i=1}^{10} (x_i / 3)}{10}$.
$\bar{x}' = \frac{1}{3} \times \left( \frac{\sum_{i=1}^{10} x_i}{10} \right)$.
Substituting the value of the original mean,we get $\bar{x}' = \frac{1}{3} \times 48 = 16$.
Thus,the new mean is $16$.
0 likes
View Solution100
MediumMCQ
The mean of $10$ observations is $16.5$. It was later noticed that one observation was taken as $57$ instead of $75$ by mistake. Find the correct mean of the data.
A
$15.1$
B
$16.2$
C
$13.5$
D
$18.3$
Solution
(D) Given that the mean of $10$ observations is $16.5$.
Sum of $10$ observations = $\text{Mean} \times \text{Number of observations} = 16.5 \times 10 = 165$.
Since one observation was taken as $57$ instead of $75$,the incorrect sum includes $57$ and excludes $75$.
Correct sum = $\text{Incorrect sum} - \text{Incorrect observation} + \text{Correct observation} = 165 - 57 + 75 = 183$.
Correct mean = $\frac{\text{Correct sum}}{\text{Number of observations}} = \frac{183}{10} = 18.3$.
0 likes
View SolutionStatistics — Mix Examples - Statistics and Probability · Frequently Asked Questions
1Are these Statistics questions useful for JEE and NEET?
Yes. All questions in this section are mapped to JEE Main and NEET exam patterns. Previous year questions from JEE Main, NEET, GUJCET and state-level exams are included with full solutions.
2Can I switch to Hindi or Gujarati for these questions?
Yes. Use the language tabs in the hero section or the sidebar to view the same questions and solutions in English, Hindi or Gujarati.
3How do I generate a question paper from this subtopic?
Use the Vedclass Exam Paper Generator — select the chapter and subtopic, set difficulty, and generate Sets A, B, C, D automatically. First 3 chapters of every subject are free.
Vedclass Products
For Students
Vedclass Test Series
Mock tests in real JEE/NEET style with performance analysis. 5-day free trial.
Start Free TrialFor Teachers
Exam Paper Generator
Generate Set A/B/C/D papers from this chapter in 2 minutes. 3 chapters free.
Try FreeFor Institutes
Online Exam Module
Live online exams with unlimited students, 360° analytics & white-label branding.
See DemoFor Teachers & Institutes
Generate a Statistics Exam Paper in 2 Minutes
Select subtopic & difficulty — Sets A, B, C, D auto-generated with No Repeat logic.
First 3 chapters of every subject are free — no payment required.