
A English
Mix Examples - Statistics and Probability Questions in English
Class 9 Mathematics · Statistics · Mix Examples - Statistics and Probability
140+
Questions
English
Language
100%
With Solutions
Showing 50 of 140 questions in English
1
EasyMCQ
The marks obtained by $17$ students in a mathematics test (out of $100$) are given below:
$91, 82, 100, 100, 96, 65, 82, 76, 79, 90, 46, 64, 72, 68, 66, 48, 49$
The range of the data is:
$91, 82, 100, 100, 96, 65, 82, 76, 79, 90, 46, 64, 72, 68, 66, 48, 49$
The range of the data is:
A
$54$
B
$46$
C
$90$
D
$100$
Solution
(A) The range of a data set is defined as the difference between the maximum value and the minimum value in the set.
Step $1$: Identify the maximum value in the given data.
The maximum value is $100$.
Step $2$: Identify the minimum value in the given data.
The minimum value is $46$.
Step $3$: Calculate the range.
$\text{Range} = \text{Maximum value} - \text{Minimum value}$
$\text{Range} = 100 - 46 = 54$
Therefore,the range of the data is $54$.
0 likes
View Solution2
EasyMCQ
The class-mark of the class $130-150$ is:
A
$130$
B
$140$
C
$135$
D
$145$
Solution
(B) The class-mark of a class interval is calculated using the formula:
$\text{Class-mark} = \frac{\text{Upper limit} + \text{Lower limit}}{2}$
Given the class interval $130-150$:
$\text{Lower limit} = 130$
$\text{Upper limit} = 150$
$\text{Class-mark} = \frac{130 + 150}{2} = \frac{280}{2} = 140$
Therefore,the correct option is $B$.
$\text{Class-mark} = \frac{\text{Upper limit} + \text{Lower limit}}{2}$
Given the class interval $130-150$:
$\text{Lower limit} = 130$
$\text{Upper limit} = 150$
$\text{Class-mark} = \frac{130 + 150}{2} = \frac{280}{2} = 140$
Therefore,the correct option is $B$.
0 likes
View Solution3
MediumMCQ
$A$ die is thrown $1000$ times and the outcomes were recorded as follows:
If the die is thrown once more,then the probability that it shows $5$ is:
| Outcome | $1$ | $2$ | $3$ | $4$ | $5$ | $6$ |
| Frequency | $180$ | $150$ | $160$ | $170$ | $150$ | $190$ |
If the die is thrown once more,then the probability that it shows $5$ is:
A
$9/50$
B
$4/25$
C
$3/20$
D
$7/25$
Solution
(C) The total number of trials is $1000$.
The frequency of the outcome $5$ is $150$.
The probability of an event is given by the ratio of the number of favorable outcomes to the total number of trials.
$P(5) = \frac{\text{Frequency of } 5}{\text{Total number of trials}}$
$P(5) = \frac{150}{1000}$
$P(5) = \frac{15}{100} = \frac{3}{20}$.
The frequency of the outcome $5$ is $150$.
The probability of an event is given by the ratio of the number of favorable outcomes to the total number of trials.
$P(5) = \frac{\text{Frequency of } 5}{\text{Total number of trials}}$
$P(5) = \frac{150}{1000}$
$P(5) = \frac{15}{100} = \frac{3}{20}$.
0 likes
View Solution4
EasyMCQ
The class mark of the class $90-120$ is:
A
$90$
B
$120$
C
$115$
D
$105$
Solution
(D) The class mark of a class interval is calculated using the formula: $\text{Class mark} = \frac{\text{Upper limit} + \text{Lower limit}}{2}$.
For the class interval $90-120$,the lower limit is $90$ and the upper limit is $120$.
$\text{Class mark} = \frac{90 + 120}{2} = \frac{210}{2} = 105$.
For the class interval $90-120$,the lower limit is $90$ and the upper limit is $120$.
$\text{Class mark} = \frac{90 + 120}{2} = \frac{210}{2} = 105$.
0 likes
View Solution5
EasyMCQ
The range of the data: $25, 18, 20, 22, 16, 6, 17, 15, 12, 30, 32, 10, 19, 8, 11, 20$ is
A
$26$
B
$10$
C
$15$
D
$18$
Solution
(A) The range of a data set is defined as the difference between the maximum and minimum values in the set.
First, identify the maximum value in the given data: $32$.
Next, identify the minimum value in the given data: $6$.
Now, calculate the range: $\text{Range} = \text{Maximum value} - \text{Minimum value} = 32 - 6 = 26$.
First, identify the maximum value in the given data: $32$.
Next, identify the minimum value in the given data: $6$.
Now, calculate the range: $\text{Range} = \text{Maximum value} - \text{Minimum value} = 32 - 6 = 26$.
0 likes
View Solution6
EasyMCQ
In a frequency distribution,the mid value of a class is $10$ and the width of the class is $6$. The lower limit of the class is:
A
$6$
B
$7$
C
$8$
D
$12$
Solution
(B) The mid value (class mark) of a class is given by the formula: $\text{Mid value} = \frac{\text{Lower limit} + \text{Upper limit}}{2}$.
Let the lower limit be $L$ and the upper limit be $U$. The width of the class is $U - L = 6$,which implies $U = L + 6$.
Substituting the values into the mid value formula:
$10 = \frac{L + (L + 6)}{2}$
$10 = \frac{2L + 6}{2}$
$10 = L + 3$
$L = 10 - 3 = 7$.
Therefore,the lower limit of the class is $7$.
0 likes
View Solution7
EasyMCQ
The width of each of five continuous classes in a frequency distribution is $5$ and the lower class-limit of the lowest class is $10$. The upper class-limit of the highest class is:
A
$15$
B
$25$
C
$35$
D
$40$
Solution
(C) The width of each of the five continuous classes in a frequency distribution is given as $5$.
The lower class limit of the lowest class is $10$.
Since the classes are continuous,the classes are formed by adding the class width to the lower limit successively.
The five classes are:
$10-15, 15-20, 20-25, 25-30, 30-35$.
Therefore,the upper class limit of the highest class is $35$.
The lower class limit of the lowest class is $10$.
Since the classes are continuous,the classes are formed by adding the class width to the lower limit successively.
The five classes are:
$10-15, 15-20, 20-25, 25-30, 30-35$.
Therefore,the upper class limit of the highest class is $35$.
0 likes
View Solution8
EasyMCQ
Let $m$ be the mid-point and $l$ be the upper class limit of a class in a continuous frequency distribution. The lower class limit of the class is:
A
$2 m + l$
B
$m - 2 l$
C
$m - l$
D
$2 m - l$
Solution
(D) We know that the mid-point $(m)$ of a class interval is calculated as:
$m = \frac{\text{Lower limit} + \text{Upper limit}}{2}$
Given that the upper class limit is $l$,we substitute it into the formula:
$m = \frac{\text{Lower limit} + l}{2}$
Multiplying both sides by $2$,we get:
$2m = \text{Lower limit} + l$
Rearranging the equation to solve for the lower class limit:
$\text{Lower limit} = 2m - l$
Therefore,the lower class limit of the class is $2m - l$.
0 likes
View Solution9
EasyMCQ
The class marks of a frequency distribution are given as follows: $15, 20, 25, \ldots$ The class interval corresponding to the class mark $20$ is:
A
$17.5-22.5$
B
$12.5-17.5$
C
$18.5-21.5$
D
$19.5-20.5$
Solution
(A) The class marks are given as $15, 20, 25, \ldots$
The class size $(h)$ is the difference between two consecutive class marks: $h = 20 - 15 = 5$.
For a class mark $x$,the class interval is given by $(x - h/2)$ to $(x + h/2)$.
For the class mark $x = 20$ and class size $h = 5$:
Lower limit = $20 - 5/2 = 20 - 2.5 = 17.5$.
Upper limit = $20 + 5/2 = 20 + 2.5 = 22.5$.
Therefore,the class interval is $17.5-22.5$.
0 likes
View Solution10
EasyMCQ
In the class intervals $10-20$ and $20-30$,the number $20$ is included in:
A
$10-20$
B
$20-30$
C
both the intervals
D
none of these intervals
Solution
(B) In a continuous frequency distribution,the class intervals are typically of the form $a-b$,where $a$ is the lower limit and $b$ is the upper limit.
By convention,the upper limit of a class interval is excluded from that interval and is included in the next class interval.
Therefore,the number $20$ is excluded from the interval $10-20$ and is included in the interval $20-30$.
By convention,the upper limit of a class interval is excluded from that interval and is included in the next class interval.
Therefore,the number $20$ is excluded from the interval $10-20$ and is included in the interval $20-30$.
0 likes
View Solution11
EasyMCQ
$A$ grouped frequency table with class intervals of equal sizes using $250-270$ ($270$ not included in this interval) as one of the class intervals is constructed for the following data:
$268, 220, 368, 258, 242, 310, 272, 342$
$310, 290, 300, 320, 319, 304, 402, 318$
$406, 292, 354, 278, 210, 240, 330, 316$
$406, 215, 258, 236$
The frequency of the class $310-330$ is:
$268, 220, 368, 258, 242, 310, 272, 342$
$310, 290, 300, 320, 319, 304, 402, 318$
$406, 292, 354, 278, 210, 240, 330, 316$
$406, 215, 258, 236$
The frequency of the class $310-330$ is:
A
$4$
B
$5$
C
$6$
D
$7$
Solution
(C) The class interval $310-330$ includes all observations $x$ such that $310 \le x < 330$.
From the given data:
$268, 220, 368, 258, 242, 310, 272, 342, 310, 290, 300, 320, 319, 304, 402, 318, 406, 292, 354, 278, 210, 240, 330, 316, 406, 215, 258, 236$.
Identifying the values that fall in the range $[310, 330)$:
$310, 310, 320, 319, 318, 316$.
Counting these values,we find there are $6$ such observations.
Therefore,the frequency of the class $310-330$ is $6$.
0 likes
View Solution12
EasyMCQ
$A$ grouped frequency distribution table with classes of equal sizes using $63-72$ ($72$ included) as one of the class is constructed for the following data:
$30, 32, 45, 54, 74, 78, 108, 112, 66, 76, 88$
$40, 14, 20, 15, 35, 44, 66, 75, 84, 95, 96$
$102, 110, 88, 74, 112, 14, 34, 44$
The number of classes in the distribution will be:
$30, 32, 45, 54, 74, 78, 108, 112, 66, 76, 88$
$40, 14, 20, 15, 35, 44, 66, 75, 84, 95, 96$
$102, 110, 88, 74, 112, 14, 34, 44$
The number of classes in the distribution will be:
A
$9$
B
$12$
C
$11$
D
$10$
Solution
(D) Step $1$: Identify the minimum and maximum values in the data.
Minimum value $= 14$,Maximum value $= 112$.
Step $2$: Determine the class size.
The given class is $63-72$. Since $72$ is included,the class size is $72 - 63 + 1 = 10$.
Step $3$: Form the classes starting from a value less than or equal to the minimum $(14)$.
Starting from $3-12$ would be possible,but to cover $14$,we start from $3-12$ or $13-22$. Using $13-22$ as the first class:
$13-22, 23-32, 33-42, 43-52, 53-62, 63-72, 73-82, 83-92, 93-102, 103-112$.
Step $4$: Count the number of classes.
There are $10$ classes in total.
Therefore,the correct option is $D$.
0 likes
View Solution13
EasyMCQ
To draw a histogram to represent the following frequency distribution:
The adjusted frequency for the class $25-45$ is:
| Class interval | $5-10$ | $10-15$ | $15-25$ | $25-45$ | $45-75$ |
| Frequency | $6$ | $12$ | $10$ | $8$ | $15$ |
The adjusted frequency for the class $25-45$ is:
A
$2$
B
$6$
C
$5$
D
$3$
Solution
(A) To draw a histogram for a frequency distribution with unequal class intervals,we calculate the adjusted frequency for each class.
$1$. Identify the minimum class width among all intervals:
- Widths are: $(10-5)=5$,$(15-10)=5$,$(25-15)=10$,$(45-25)=20$,$(75-45)=30$.
- The minimum class width is $5$.
$2$. The formula for adjusted frequency is:
$\text{Adjusted Frequency} = \frac{\text{Frequency of the class}}{\text{Class width}} \times \text{Minimum class width}$.
$3$. For the class $25-45$:
- Frequency = $8$.
- Class width = $45 - 25 = 20$.
- Minimum class width = $5$.
$4$. Calculation:
$\text{Adjusted Frequency} = \frac{8}{20} \times 5 = \frac{8}{4} = 2$.
0 likes
View Solution14
EasyMCQ
The mean of five numbers is $30$. If one number is excluded,their mean becomes $28$. The excluded number is:
A
$28$
B
$38$
C
$35$
D
$30$
Solution
(B) The mean of five numbers is $30$.
Sum of five numbers $= 30 \times 5 = 150$.
Let the excluded number be $x$.
When one number is excluded,the sum of the remaining four numbers is $(150 - x)$.
The mean of these four numbers is given as $28$.
Therefore,$\frac{150 - x}{4} = 28$.
Multiplying both sides by $4$,we get $150 - x = 112$.
Solving for $x$,we get $x = 150 - 112 = 38$.
Thus,the excluded number is $38$.
0 likes
View Solution15
MediumMCQ
If the mean of the observations $x, x+3, x+5, x+7, x+10$ is $9,$ find the mean of the last three observations.
A
$10 \frac{1}{3}$
B
$10 \frac{2}{3}$
C
$11 \frac{1}{3}$
D
$11 \frac{2}{3}$
Solution
(C) The mean of the observations is given by the sum of observations divided by the total number of observations.
Given observations: $x, x+3, x+5, x+7, x+10$.
Number of observations $= 5$.
Mean $= \frac{x + (x+3) + (x+5) + (x+7) + (x+10)}{5} = 9$.
$\Rightarrow \frac{5x + 25}{5} = 9$.
$\Rightarrow 5x + 25 = 45$.
$\Rightarrow 5x = 20$.
$\Rightarrow x = 4$.
The last three observations are $x+5, x+7, x+10$.
Substituting $x = 4$,we get: $4+5=9, 4+7=11, 4+10=14$.
The mean of the last three observations $= \frac{9 + 11 + 14}{3} = \frac{34}{3} = 11 \frac{1}{3}$.
0 likes
View Solution16
MediumMCQ
If $\bar{x}$ represents the mean of $n$ observations $x_{1}, x_{2}, \ldots, x_{n},$ then the value of $\sum_{i=1}^{n}(x_{i}-\bar{x})$ is
A
$n-1$
B
$-1$
C
$1$
D
$0$
Solution
(D) We know that the algebraic sum of deviations from the mean is always zero.
$\sum_{i=1}^{n}(x_{i}-\bar{x}) = (x_{1}-\bar{x}) + (x_{2}-\bar{x}) + \ldots + (x_{n}-\bar{x})$
$= (x_{1} + x_{2} + \ldots + x_{n}) - n\bar{x}$
Since the mean $\bar{x} = \frac{1}{n} \sum_{i=1}^{n} x_{i}$,we have $\sum_{i=1}^{n} x_{i} = n\bar{x}$.
Substituting this into the expression:
$= n\bar{x} - n\bar{x} = 0$.
0 likes
View Solution17
EasyMCQ
If each observation of the data is increased by $5,$ then their mean
A
is increased by $5$
B
is decreased by $5$
C
becomes $5$ times the original mean
D
remains the same
Solution
(A) Let the observations be $x_1, x_2, ..., x_n$. The mean is $\bar{x} = \frac{\sum x_i}{n}$.
If each observation is increased by $5$,the new observations are $(x_1+5), (x_2+5), ..., (x_n+5)$.
The new mean $\bar{x}' = \frac{\sum (x_i+5)}{n} = \frac{\sum x_i + 5n}{n} = \frac{\sum x_i}{n} + \frac{5n}{n} = \bar{x} + 5$.
Therefore,if each observation of the data is increased by $5$,then their mean is also increased by $5$.
0 likes
View Solution18
MediumMCQ
If $\bar{x}$ is the mean of $x_{1}, x_{2}, \ldots, x_{n}$ and $\bar{y}$ is the mean of $y_{1}, y_{2}, \ldots, y_{n}$. If $\bar{z}$ is the mean of $x_{1}, x_{2}, \ldots, x_{n}, y_{1}, y_{2}, \ldots, y_{n}$,then $\bar{z}$ is equal to
A
$\bar{x}+\bar{y}$
B
$\frac{\bar{x}+\bar{y}}{2}$
C
$\frac{\bar{x}+\bar{y}}{n}$
D
$\frac{\bar{x}+\bar{y}}{2n}$
Solution
(B) Given that $\bar{x}$ is the mean of $n$ observations $x_{1}, x_{2}, \ldots, x_{n}$.
Therefore,the sum of these observations is $\sum_{i=1}^{n} x_{i} = n \bar{x}$.
Similarly,$\bar{y}$ is the mean of $n$ observations $y_{1}, y_{2}, \ldots, y_{n}$.
Therefore,the sum of these observations is $\sum_{i=1}^{n} y_{i} = n \bar{y}$.
Now,$\bar{z}$ is the mean of all $2n$ observations $(x_{1}, \ldots, x_{n}, y_{1}, \ldots, y_{n})$.
Thus,$\bar{z} = \frac{\sum x_{i} + \sum y_{i}}{n + n}$.
Substituting the sums,we get $\bar{z} = \frac{n \bar{x} + n \bar{y}}{2n}$.
Simplifying this,$\bar{z} = \frac{n(\bar{x} + \bar{y})}{2n} = \frac{\bar{x} + \bar{y}}{2}$.
0 likes
View Solution19
DifficultMCQ
If $\bar{x}$ is the mean of $x_{1}, x_{2}, \ldots, x_{n},$ then for $a \neq 0,$ the mean of $a x_{1}, a x_{2}, \ldots, a x_{n}, \frac{x_{1}}{a}, \frac{x_{2}}{a}, \ldots, \frac{x_{n}}{a}$ is
A
$\left(a+\frac{1}{a}\right) \bar{x}$
B
$\left(a+\frac{1}{a}\right) \frac{\bar{x}}{2}$
C
$\frac{(a+\frac{1}{a}) \bar{x}}{2 n}$
D
$\left(a+\frac{1}{a}\right) \frac{\bar{x}}{n}$
Solution
(B) We know that if $\bar{x}$ is the mean of $x_{1}, x_{2}, \ldots, x_{n},$ then $\bar{x} = \frac{\sum_{i=1}^{n} x_{i}}{n},$ which implies $\sum_{i=1}^{n} x_{i} = n \bar{x}.$
The new set of observations consists of $2n$ terms: $a x_{1}, a x_{2}, \ldots, a x_{n}$ and $\frac{x_{1}}{a}, \frac{x_{2}}{a}, \ldots, \frac{x_{n}}{a}.$
The mean of these $2n$ observations is given by:
Mean $= \frac{(a x_{1} + a x_{2} + \ldots + a x_{n}) + (\frac{x_{1}}{a} + \frac{x_{2}}{a} + \ldots + \frac{x_{n}}{a})}{2n}$
$= \frac{a(x_{1} + x_{2} + \ldots + x_{n}) + \frac{1}{a}(x_{1} + x_{2} + \ldots + x_{n})}{2n}$
$= \frac{a(n \bar{x}) + \frac{1}{a}(n \bar{x})}{2n}$
$= \frac{n \bar{x} (a + \frac{1}{a})}{2n}$
$= \frac{\bar{x}}{2} (a + \frac{1}{a}).$
0 likes
View Solution20
MediumMCQ
If $\bar{x}_{1}, \bar{x}_{2}, \bar{x}_{3}, \ldots, \bar{x}_{n}$ are the means of $n$ groups with $n_{1}, n_{2}, \ldots, n_{n}$ number of observations respectively,then the combined mean $\bar{x}$ of all the groups taken together is given by:
A
$\sum_{i=1}^{n} n_{i} \bar{x}_{i}$
B
$\frac{\sum_{i=1}^{n} n_{i} \bar{x}_{i}}{n^{2}}$
C
$\frac{\sum_{i=1}^{n} n_{i} \bar{x}_{i}}{2 n}$
D
$\frac{\sum_{i=1}^{n} n_{i} \bar{x}_{i}}{\sum_{i=1}^{n} n_{i}}$
Solution
(D) The mean of a group is defined as the sum of observations divided by the number of observations. For group $i$,the sum of observations is $S_{i} = n_{i} \bar{x}_{i}$.
To find the combined mean $\bar{x}$ of all $n$ groups,we divide the total sum of all observations by the total number of observations.
Total sum of observations = $\sum_{i=1}^{n} n_{i} \bar{x}_{i}$
Total number of observations = $\sum_{i=1}^{n} n_{i}$
Therefore,the combined mean is $\bar{x} = \frac{\sum_{i=1}^{n} n_{i} \bar{x}_{i}}{\sum_{i=1}^{n} n_{i}}$.
0 likes
View Solution21
MediumMCQ
The mean of $100$ observations is $50$. If one of the observations which was $50$ is replaced by $150$,the resulting mean will be:
A
$51$
B
$50.5$
C
$51.5$
D
$52$
Solution
(A) The formula for the mean is $\bar{x} = \frac{\sum x_i}{n}$.
Given that the mean of $100$ observations is $50$,we have $\sum x_i = 50 \times 100 = 5,000$.
When an observation of $50$ is replaced by $150$,the new sum of observations becomes $\sum x_i' = 5,000 - 50 + 150 = 5,100$.
The new mean is calculated as $\frac{5,100}{100} = 51$.
Given that the mean of $100$ observations is $50$,we have $\sum x_i = 50 \times 100 = 5,000$.
When an observation of $50$ is replaced by $150$,the new sum of observations becomes $\sum x_i' = 5,000 - 50 + 150 = 5,100$.
The new mean is calculated as $\frac{5,100}{100} = 51$.
0 likes
View Solution22
MediumMCQ
There are $50$ numbers. Each number is subtracted from $53$ and the mean of the numbers so obtained is found to be $-3.5$. The mean of the given numbers is: (in $.5$)
A
$46$
B
$56$
C
$53$
D
$49$
Solution
(B) Let the $50$ numbers be $x_1, x_2, \dots, x_{50}$ and their mean be $\bar{x}$.
According to the problem, each number is subtracted from $53$, so the new numbers are $(53 - x_1), (53 - x_2), \dots, (53 - x_{50})$.
The mean of these new numbers is given as $-3.5$.
$\text{Mean} = \frac{\sum_{i=1}^{50} (53 - x_i)}{50} = -3.5$
$\Rightarrow \frac{(53 \times 50) - \sum_{i=1}^{50} x_i}{50} = -3.5$
Since $\bar{x} = \frac{\sum x_i}{50}$, we have $\sum x_i = 50 \bar{x}$.
Substituting this into the equation:
$\Rightarrow \frac{2650 - 50 \bar{x}}{50} = -3.5$
$\Rightarrow 53 - \bar{x} = -3.5$
$\Rightarrow \bar{x} = 53 + 3.5 = 56.5$
Thus, the mean of the given numbers is $56.5$.
0 likes
View Solution23
MediumMCQ
The mean of $25$ observations is $36$. If the mean of the first $13$ observations is $32$ and the mean of the last $13$ observations is $40$,find the $13^{\text{th}}$ observation.
A
$23$
B
$38$
C
$36$
D
$40$
Solution
(C) Given that the mean of $25$ observations is $36$.
Sum of $25$ observations $= 25 \times 36 = 900$.
Mean of the first $13$ observations $= 32$.
Sum of the first $13$ observations $= 13 \times 32 = 416$.
Mean of the last $13$ observations $= 40$.
Sum of the last $13$ observations $= 13 \times 40 = 520$.
The $13^{\text{th}}$ observation is included in both the first $13$ and the last $13$ observations.
Therefore,the $13^{\text{th}}$ observation $= (\text{Sum of first } 13) + (\text{Sum of last } 13) - (\text{Sum of } 25)$.
$13^{\text{th}}$ observation $= 416 + 520 - 900 = 936 - 900 = 36$.
0 likes
View Solution24
MediumMCQ
The median of the data $78, 56, 22, 34, 45, 54, 39, 54, 84$ is
A
$45$
B
$49.5$
C
$56$
D
$54$
Solution
(D) Arranging the data in ascending order,we get:
$22, 34, 39, 45, 54, 54, 56, 78, 84$
Here,the number of observations $n = 9$,which is an odd number.
Therefore,the median is the value of the $\left(\frac{n+1}{2}\right)^{th}$ term.
Median $= \left(\frac{9+1}{2}\right)^{th}$ term $= 5^{th}$ term.
Looking at the ordered data,the $5^{th}$ term is $54$.
Thus,the median is $54$.
0 likes
View Solution25
EasyMCQ
For drawing a frequency polygon of a continuous frequency distribution,we plot the points whose ordinates are the frequencies of the respective classes and abscissae are respectively:
A
class marks of the classes
B
lower limits of the classes
C
upper limits of the classes
D
upper limits of preceding classes
Solution
(A) To draw a frequency polygon for a continuous frequency distribution,we plot points on a graph. The $y$-coordinate (ordinate) of each point represents the frequency of the respective class,and the $x$-coordinate (abscissa) represents the class mark of that class. The class mark is calculated as $\frac{\text{Lower Limit} + \text{Upper Limit}}{2}$.
0 likes
View Solution26
MediumMCQ
Median of the following numbers: $4, 4, 5, 7, 6, 7, 7, 12, 3$ is
A
$4$
B
$6$
C
$5$
D
$7$
Solution
(B) Arranging the data in ascending order,we get:
$3, 4, 4, 5, 6, 7, 7, 7, 12$
Here,the total number of observations $n = 9$,which is an odd number.
Therefore,the median is the value of the $\left(\frac{n+1}{2}\right)^{th}$ term.
Median $= \left(\frac{9+1}{2}\right)^{th} = 5^{th}$ term.
The $5^{th}$ term in the ordered sequence is $6$.
Hence,the median is $6$.
0 likes
View Solution27
MediumMCQ
Mode of the data $15, 14, 19, 20, 14, 15, 16, 14, 15, 18, 14, 19, 15, 17, 15$ is
A
$14$
B
$16$
C
$15$
D
$17$
Solution
(C) The mode is defined as the observation that occurs most frequently in a given data set.
Given data: $15, 14, 19, 20, 14, 15, 16, 14, 15, 18, 14, 19, 15, 17, 15$
By arranging the observations in ascending order,we get:
$14, 14, 14, 14, 15, 15, 15, 15, 15, 16, 17, 18, 19, 19, 20$
Counting the frequency of each observation:
$14$ appears $4$ times.
$15$ appears $5$ times.
$16$ appears $1$ time.
$17$ appears $1$ time.
$18$ appears $1$ time.
$19$ appears $2$ times.
$20$ appears $1$ time.
Since $15$ occurs the maximum number of times ($5$ times),it is the mode of the given data.
Therefore,the mode is $15$.
0 likes
View Solution28
Easy
The mean of the data: $2, 8, 6, 5, 4, 5, 6, 3, 6, 4, 9, 1, 5, 6, 5$ is given to be $5$. Based on this information,is it correct to say that the mean of the data: $10, 12, 10, 2, 18, 8, 12, 6, 12, 10, 8, 10, 12, 16, 4$ is $10$? Give reason.
Solution
(A) Yes,it is correct.
Let the first set of data be $x_i$. The mean is given as $\bar{x} = 5$.
The second set of data is $y_i = 2x_i$.
According to the properties of the mean,if each observation in a data set is multiplied by a constant $k$,the new mean becomes $k$ times the original mean.
Here,$k = 2$.
Therefore,the new mean = $2 \times 5 = 10$.
Thus,the statement is correct.
0 likes
View Solution29
EasyMCQ
In a histogram, the areas of the rectangles are proportional to the frequencies. Can we say that the lengths of the rectangles are also proportional to the frequencies?
A
Yes, always.
B
No, it is only true when the class sizes are equal.
C
Yes, if the class sizes are different.
D
None of the above.
Solution
(B) In a histogram, the area of each rectangle is given by the formula: $\text{Area} = \text{Width} \times \text{Height}$.
Here, the $\text{Width}$ represents the class size and the $\text{Height}$ represents the frequency density.
Since the $\text{Area}$ is proportional to the frequency, we have $\text{Frequency} \propto \text{Width} \times \text{Height}$.
If the class sizes (widths) are equal, then $\text{Width}$ is constant, which implies $\text{Frequency} \propto \text{Height}$.
However, if the class sizes are different, the height of the rectangle is adjusted to maintain the proportionality of the area to the frequency.
Therefore, the lengths (heights) of the rectangles are proportional to the frequencies only when the class sizes are the same.
0 likes
View Solution30
Easy
Consider the data $: 2, 3, 9, 16, 9, 3, 9$. Since $16$ is the highest value in the observations,is it correct to say that it is the mode of the data? Give reason.
Solution
(B) $16$ is not the mode of the data. The mode of a given data is the observation with the highest frequency,not the observation with the highest value. In the given data,the frequency of $9$ is $3$,which is the highest frequency. Therefore,the mode of the data is $9$.
0 likes
View Solution31
Easy
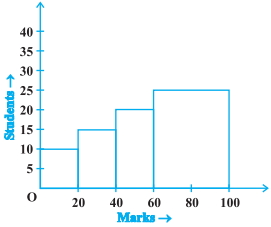
The frequency distribution is given below:
This distribution has been represented graphically as shown in the image. Is this representation correct? Explain.
| Marks | $0-20$ | $20-40$ | $40-60$ | $60-100$ |
| Number of Students | $10$ | $15$ | $20$ | $25$ |
This distribution has been represented graphically as shown in the image. Is this representation correct? Explain.
Solution
(N/A) The given graphical representation is incorrect.
In a histogram,the area of each rectangle is proportional to the frequency of the corresponding class interval. When class intervals are of unequal width,the heights of the rectangles must be adjusted to be proportional to the frequency density,which is defined as $\frac{\text{Frequency}}{\text{Width of class interval}}$.
Here,the class widths are:
$0-20$: width $= 20$
$20-40$: width $= 20$
$40-60$: width $= 20$
$60-100$: width $= 40$
Since the last interval $(60-100)$ has a different width,the height of the rectangle for this interval should have been adjusted to maintain the area proportionality. The current graph simply plots frequency against class intervals,which is only valid for equal class widths.
0 likes
View Solution32
Medium
In a diagnostic test in mathematics given to students,the following marks (out of $100$) are recorded:
$46, 52, 48, 11, 41, 62, 54, 53, 96, 40, 98, 44$
Which 'average' will be a good representative of the above data and why?
$46, 52, 48, 11, 41, 62, 54, 53, 96, 40, 98, 44$
Which 'average' will be a good representative of the above data and why?
Solution
(B) The median is the best representative of the given data.
The recorded marks (out of $100$) are: $46, 52, 48, 11, 41, 62, 54, 53, 96, 40, 98, 44$.
The median is a good representative because:
$(i)$ The mean is significantly influenced by extreme values (outliers) such as $11, 96,$ and $98$,which pull the average away from the central cluster of scores.
$(ii)$ The median provides a better measure of central tendency when the data set contains extreme values,as it represents the middle value of the ordered data set.
0 likes
View Solution33
EasyMCQ
$A$ child says that the median of $3, 14, 18, 20, 5$ is $18$. What does the child not understand about finding the median?
A
The child did not arrange the data in ascending or descending order.
B
The child calculated the mean instead of the median.
C
The child chose the largest number instead of the middle one.
D
The child failed to count the total number of observations.
Solution
(A) To find the median of a given set of data,the observations must first be arranged in either ascending or descending order.
In the given set $3, 14, 18, 20, 5$,the values are not in order.
If we arrange them in ascending order,we get $3, 5, 14, 18, 20$.
The middle observation is $14$,which is the correct median.
The child simply picked the middle value of the unordered list,which is incorrect.
In the given set $3, 14, 18, 20, 5$,the values are not in order.
If we arrange them in ascending order,we get $3, 5, 14, 18, 20$.
The middle observation is $14$,which is the correct median.
The child simply picked the middle value of the unordered list,which is incorrect.
0 likes
View Solution34
Medium
$A$ football player scored the following number of goals in $10$ matches:
$1, 3, 2, 5, 8, 6, 1, 4, 7, 9$
Since the number of matches is $10$ (an even number),the median is calculated as:
Median $= \frac{5^{\text{th}} \text{ observation} + 6^{\text{th}} \text{ observation}}{2}$
$= \frac{8 + 6}{2} = 7$
Is this the correct answer? If not,why?
$1, 3, 2, 5, 8, 6, 1, 4, 7, 9$
Since the number of matches is $10$ (an even number),the median is calculated as:
Median $= \frac{5^{\text{th}} \text{ observation} + 6^{\text{th}} \text{ observation}}{2}$
$= \frac{8 + 6}{2} = 7$
Is this the correct answer? If not,why?
Solution
(D) The answer $7$ is incorrect. To find the median of a data set,the observations must first be arranged in ascending or descending order.
Step $1$: Arrange the data in ascending order:
$1, 1, 2, 3, 4, 5, 6, 7, 8, 9$
Step $2$: Since the number of observations $n = 10$ (which is even),the median is the average of the $5^{\text{th}}$ and $6^{\text{th}}$ observations.
$5^{\text{th}}$ observation $= 4$
$6^{\text{th}}$ observation $= 5$
Median $= \frac{4 + 5}{2} = \frac{9}{2} = 4.5$
Therefore,the correct median is $4.5$.
0 likes
View Solution35
Easy
Is it correct to say that in a histogram,the area of each rectangle is proportional to the class size of the corresponding class interval? If not,correct the statement.
Solution
(B) The given statement is not correct. In a histogram,the area of each rectangle is proportional to the frequency of its class. If the class intervals are of equal width,the height of the rectangle is proportional to the frequency. If the class intervals are of unequal width,the area of the rectangle is proportional to the frequency.
0 likes
View Solution36
Medium
The class marks of a continuous distribution are: $1.04, 1.14, 1.24, 1.34, 1.44, 1.54$ and $1.64$. Is it correct to say that the last interval will be $1.55-1.73$? Justify your answer.
Solution
(B) The class marks of the continuous distribution are $1.04, 1.14, 1.24, 1.34, 1.44, 1.54$,and $1.64$.
The difference between two consecutive class marks is $h = 1.14 - 1.04 = 1.24 - 1.14 = \dots = 1.64 - 1.54 = 0.10$.
This difference $h$ represents the class size of the continuous distribution.
The class size of the interval $1.55 - 1.73$ is $1.73 - 1.55 = 0.18$.
Since the class size of the given interval $(0.18)$ is not equal to the class size of the distribution $(0.10)$,it is not correct to say that the last interval is $1.55 - 1.73$.
0 likes
View Solution37
MediumMCQ
$30$ children were asked about the number of hours they watched $TV$ programmes last week. The results are recorded as under:
Can we say that the number of children who watched $TV$ for $10$ or more hours a week is $22$? Justify your answer.
| Number of hours | $0-5$ | $5-10$ | $10-15$ | $15-20$ |
| Frequency | $8$ | $16$ | $4$ | $2$ |
Can we say that the number of children who watched $TV$ for $10$ or more hours a week is $22$? Justify your answer.
A
Yes
B
No
C
Cannot be determined
D
None of these
Solution
(B) In a continuous frequency distribution,the upper limit of a class interval is excluded from that class and included in the next class.
Therefore,the value $10$ is included in the class interval $10-15$ and not in $5-10$.
To find the number of children who watched $TV$ for $10$ or more hours,we sum the frequencies of the class intervals $10-15$ and $15-20$.
Number of children = $4 + 2 = 6$.
Thus,we cannot say that the number of children who watched $TV$ for $10$ or more hours a week is $22$.
0 likes
View Solution38
Medium
Heights (in $cm$) of $30$ girls of Class $IX$ are given below:
$140, 140, 160, 139, 153, 153, 146, 150, 148, 150, 152$
$146, 154, 150, 160, 148, 150, 148, 140, 148, 153, 138$
$152, 150, 148, 138, 152, 140, 146, 148$
Prepare a frequency distribution table for this data.
$140, 140, 160, 139, 153, 153, 146, 150, 148, 150, 152$
$146, 154, 150, 160, 148, 150, 148, 140, 148, 153, 138$
$152, 150, 148, 138, 152, 140, 146, 148$
Prepare a frequency distribution table for this data.
Solution
(N/A) To prepare the frequency distribution table,we count the occurrences of each height value in the given data set.
Frequency distribution of heights of $30$ girls:
Frequency distribution of heights of $30$ girls:
| Height (in $cm$) | Frequency |
| $138$ | $2$ |
| $139$ | $1$ |
| $140$ | $4$ |
| $146$ | $3$ |
| $148$ | $6$ |
| $150$ | $5$ |
| $152$ | $3$ |
| $153$ | $3$ |
| $154$ | $1$ |
| $160$ | $2$ |
| Total | $30$ |
0 likes
View Solution39
MediumMCQ
The following observations are arranged in ascending order:
$26, 29, 42, 53, x, x+2, 70, 75, 82, 93$
If the median is $65,$ find the value of $x$.
$26, 29, 42, 53, x, x+2, 70, 75, 82, 93$
If the median is $65,$ find the value of $x$.
A
$63$
B
$62$
C
$61$
D
$64$
Solution
(D) Number of observations $(n) = 10,$ which is even.
Therefore,the median is the mean of the $\left(\frac{n}{2}\right)^{\text{th}}$ and $\left(\frac{n}{2}+1\right)^{\text{th}}$ observations,i.e.,the $5^{\text{th}}$ and $6^{\text{th}}$ observations.
Here,the $5^{\text{th}}$ observation $= x$ and the $6^{\text{th}}$ observation $= x+2$.
Median $= \frac{x + (x+2)}{2} = \frac{2x+2}{2} = x+1$.
Given that the median is $65,$ we have $x+1 = 65$.
Therefore,$x = 65 - 1 = 64$.
Thus,the value of $x$ is $64.$
0 likes
View Solution40
Medium
The blood groups of $30$ students are recorded as follows:
$A, B, O, A, AB, O, A, O, B, A, O, B, A, AB, B, A, AB, B$
$A, A, O, A, AB, B, A, O, B, A, B, A$
Prepare a frequency distribution table for the data.
$A, B, O, A, AB, O, A, O, B, A, O, B, A, AB, B, A, AB, B$
$A, A, O, A, AB, B, A, O, B, A, B, A$
Prepare a frequency distribution table for the data.
Solution
To prepare the frequency distribution table,we count the occurrences of each blood group in the given data:
$1$. Count of $A$: $12$
$2$. Count of $B$: $8$
$3$. Count of $AB$: $4$
$4$. Count of $O$: $6$
Total count = $12 + 8 + 4 + 6 = 30$.
$1$. Count of $A$: $12$
$2$. Count of $B$: $8$
$3$. Count of $AB$: $4$
$4$. Count of $O$: $6$
Total count = $12 + 8 + 4 + 6 = 30$.
| Blood Group | No. of students (frequency) |
| $A$ | $12$ |
| $B$ | $8$ |
| $AB$ | $4$ |
| $O$ | $6$ |
| Total | $30$ |
0 likes
View Solution41
Easy
The value of $\pi$ up to $35$ decimal places is given below:
$3.14159265358979323846264338327950288$
Make a frequency distribution table of the digits $0$ to $9$ after the decimal point.
$3.14159265358979323846264338327950288$
Make a frequency distribution table of the digits $0$ to $9$ after the decimal point.
Solution
(N/A) To find the frequency distribution,we count the occurrences of each digit from $0$ to $9$ in the sequence after the decimal point: $1, 4, 1, 5, 9, 2, 6, 5, 3, 5, 8, 9, 7, 9, 3, 2, 3, 8, 4, 6, 2, 6, 4, 3, 3, 8, 3, 2, 7, 9, 5, 0, 2, 8, 8$.
| Digit | Frequency |
|---|---|
| $0$ | $1$ |
| $1$ | $2$ |
| $2$ | $5$ |
| $3$ | $6$ |
| $4$ | $3$ |
| $5$ | $4$ |
| $6$ | $3$ |
| $7$ | $2$ |
| $8$ | $5$ |
| $9$ | $4$ |
0 likes
View Solution42
Medium
The scores (out of $100$) obtained by $33$ students in a mathematics test are as follows:
$69, 48, 84, 58, 48, 73, 83, 48, 66, 58, 84$
$66, 64, 71, 64, 66, 69, 66, 83, 66, 69, 71$
$81, 71, 73, 69, 66, 66, 64, 58, 64, 69, 69$
Represent this data in the form of a frequency distribution table.
$69, 48, 84, 58, 48, 73, 83, 48, 66, 58, 84$
$66, 64, 71, 64, 66, 69, 66, 83, 66, 69, 71$
$81, 71, 73, 69, 66, 66, 64, 58, 64, 69, 69$
Represent this data in the form of a frequency distribution table.
Solution
To represent the data in a frequency distribution table,we count the number of times each score appears (frequency).
| Scores | Frequency |
| $48$ | $3$ |
| $58$ | $3$ |
| $64$ | $4$ |
| $66$ | $7$ |
| $69$ | $6$ |
| $71$ | $3$ |
| $73$ | $2$ |
| $81$ | $1$ |
| $83$ | $2$ |
| $84$ | $2$ |
| Total | $33$ |
0 likes
View Solution43
Medium
Prepare a continuous grouped frequency distribution from the following data:
Also,find the size of the class intervals.
| Mid-point | Frequency |
| $5$ | $4$ |
| $15$ | $8$ |
| $25$ | $13$ |
| $35$ | $12$ |
| $45$ | $6$ |
Also,find the size of the class intervals.
Solution
The mid-points are $5, 15, 25, 35,$ and $45.$ The common difference between consecutive class marks is $h = 15 - 5 = 10.$
To find the class intervals,we subtract and add $\frac{h}{2} = \frac{10}{2} = 5$ from each mid-point.
For mid-point $5$: $5 - 5 = 0$ and $5 + 5 = 10$,so the interval is $0-10$.
For mid-point $15$: $15 - 5 = 10$ and $15 + 5 = 20$,so the interval is $10-20$.
For mid-point $25$: $25 - 5 = 20$ and $25 + 5 = 30$,so the interval is $20-30$.
For mid-point $35$: $35 - 5 = 30$ and $35 + 5 = 40$,so the interval is $30-40$.
For mid-point $45$: $45 - 5 = 40$ and $45 + 5 = 50$,so the interval is $40-50$.
The size of the class interval is $10.$
$A$ continuous grouped frequency distribution is given below:
| Class Interval | Frequency |
| $0-10$ | $4$ |
| $10-20$ | $8$ |
| $20-30$ | $13$ |
| $30-40$ | $12$ |
| $40-50$ | $6$ |
0 likes
View Solution44
Medium
Convert the given frequency distribution into a continuous grouped frequency distribution:
In which intervals would $153.5$ and $157.5$ be included?
| Class interval | Frequency |
| $150-153$ | $7$ |
| $154-157$ | $7$ |
| $158-161$ | $15$ |
| $162-165$ | $10$ |
| $166-169$ | $5$ |
| $170-173$ | $6$ |
In which intervals would $153.5$ and $157.5$ be included?
Solution
(N/A) To convert a discontinuous frequency distribution into a continuous one,we find the difference between the lower limit of a class and the upper limit of the preceding class. Let this difference be $d$. The adjustment factor is $h = d/2$.
Here,$d = 154 - 153 = 1$. Thus,$h = 1/2 = 0.5$.
We subtract $0.5$ from each lower limit and add $0.5$ to each upper limit.
Based on the continuous intervals:
- $153.5$ is included in the interval $153.5-157.5$.
- $157.5$ is included in the interval $157.5-161.5$.
Here,$d = 154 - 153 = 1$. Thus,$h = 1/2 = 0.5$.
We subtract $0.5$ from each lower limit and add $0.5$ to each upper limit.
| Original Class | Continuous Class | Frequency |
| $150-153$ | $149.5-153.5$ | $7$ |
| $154-157$ | $153.5-157.5$ | $7$ |
| $158-161$ | $157.5-161.5$ | $15$ |
| $162-165$ | $161.5-165.5$ | $10$ |
| $166-169$ | $165.5-169.5$ | $5$ |
| $170-173$ | $169.5-173.5$ | $6$ |
Based on the continuous intervals:
- $153.5$ is included in the interval $153.5-157.5$.
- $157.5$ is included in the interval $157.5-161.5$.
0 likes
View Solution45
Medium
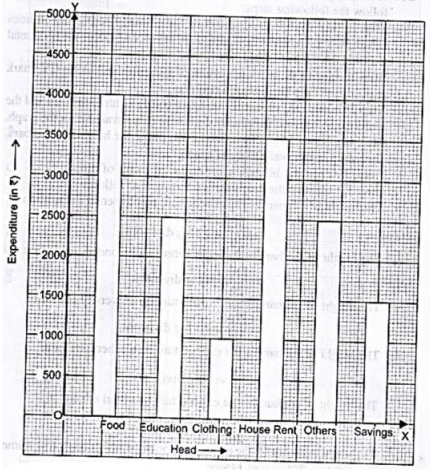
The expenditure of a family on different heads in a month is given below:
Draw a bar graph to represent the data above.
| Head | Expenditure (in $Rs$) |
|---|---|
| Food | $4000$ |
| Education | $2500$ |
| Clothing | $1000$ |
| House Rent | $3500$ |
| Others | $2500$ |
| Savings | $1500$ |
Draw a bar graph to represent the data above.
Solution
(N/A) To represent the given data using a bar graph,follow these steps:
$1$. Draw two perpendicular axes,the horizontal axis ($X$-axis) and the vertical axis ($Y$-axis).
$2$. Along the $X$-axis,represent the different heads of expenditure at equal intervals.
$3$. Along the $Y$-axis,represent the expenditure in $Rs$. Choose an appropriate scale,for example,$1 \text{ unit} = 500 \text{ Rs}$.
$4$. For each head,draw a rectangular bar of equal width. The height of each bar corresponds to the numerical value of the expenditure for that specific head.
$5$. The resulting bar graph is shown below:
$1125$-s50
0 likes
View Solution46
Difficult
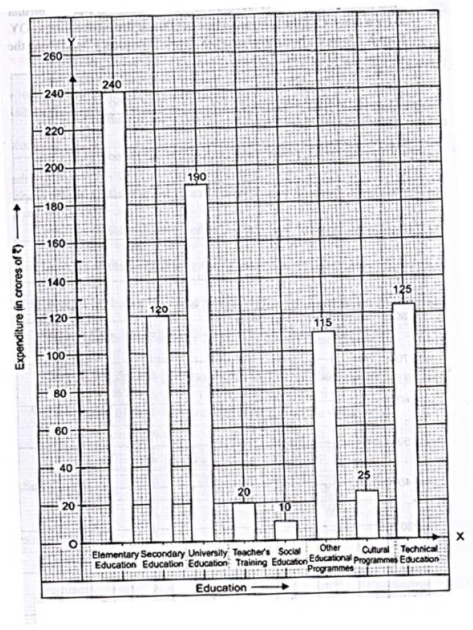
Expenditure on education of a country during a five-year period $(2002-2006)$,in crores of rupees,is given below:
Represent the information above by a bar graph.
| Elementary education | $240$ |
| Secondary education | $120$ |
| University education | $190$ |
| Teacher's training | $20$ |
| Social education | $10$ |
| Other educational programmes | $115$ |
| Cultural programmes | $25$ |
| Technical education | $125$ |
Represent the information above by a bar graph.
Solution
(N/A) To construct a bar graph representing the given data,follow these steps:
Step $1$: Take a graph paper and draw two mutually perpendicular lines $OX$ and $OY$. Let $OX$ be the horizontal axis and $OY$ be the vertical axis.
Step $2$: Along $OX$,mark the types of education,and along $OY$,mark the expenditure (in crores of rupees).
Step $3$: Along $OX$,choose a uniform width for the bars and a uniform gap between them.
Step $4$: Choose a suitable scale for the vertical axis. Here,we choose $1$ big division to represent $20$ crores of rupees.
Step $5$: Calculate the height of each bar:
- Elementary education: $240 / 20 = 12$ big divisions
- Secondary education: $120 / 20 = 6$ big divisions
- University education: $190 / 20 = 9.5$ big divisions
- Teacher's training: $20 / 20 = 1$ big division
- Social education: $10 / 20 = 0.5$ big divisions
- Other educational programmes: $115 / 20 = 5.75$ big divisions
- Cultural programmes: $25 / 20 = 1.25$ big divisions
- Technical education: $125 / 20 = 6.25$ big divisions
Step $6$: Draw the bars according to these heights as shown in the figure.
0 likes
View Solution47
Medium
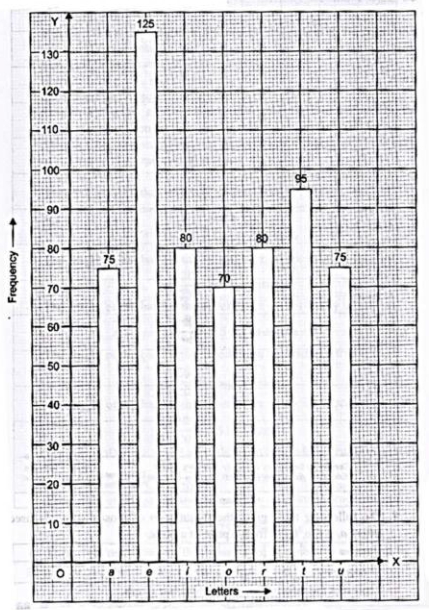
The following table gives the frequencies of most commonly used letters $a, e, i, o, r, t, u$ from a page of a book:
Represent the information above by a bar graph.
| Letters | $a$ | $e$ | $i$ | $o$ | $r$ | $t$ | $u$ |
| Frequency | $75$ | $125$ | $80$ | $70$ | $80$ | $95$ | $75$ |
Represent the information above by a bar graph.
Solution
(N/A) To construct the bar graph,follow these steps:
Step $1:$ Take a graph paper and draw two perpendicular lines $OX$ and $OY$.
Step $2:$ Along the horizontal axis $OX$,mark the 'Letters' and along the vertical axis $OY$,mark the 'Frequency'.
Step $3:$ Along the horizontal axis $OX$,choose a uniform width for the bars and a uniform gap between them.
Step $4:$ Choose a suitable scale for the vertical axis. Let $1$ unit represent $10$ units of frequency.
Step $5:$ Draw bars of appropriate heights corresponding to the frequencies given in the table.
Step $6:$ Label the axes and write the frequency on top of each bar as shown in the figure.
0 likes
View Solution48
MediumMCQ
If the mean of the following data is $20.2,$ find the value of $p:$
$\begin{array}{|c|c|c|c|c|c|} \hline x & 10 & 15 & 20 & 25 & 30 \\ \hline f & 6 & 8 & p & 10 & 6 \\ \hline \end{array}$
$\begin{array}{|c|c|c|c|c|c|} \hline x & 10 & 15 & 20 & 25 & 30 \\ \hline f & 6 & 8 & p & 10 & 6 \\ \hline \end{array}$
A
$20$
B
$10$
C
$5$
D
$2$
Solution
(A) The formula for the mean is $\bar{x} = \frac{\sum x_i f_i}{\sum f_i}$.
First,calculate the sum of frequencies $\sum f_i = 6 + 8 + p + 10 + 6 = 30 + p$.
Next,calculate the sum of the products $\sum x_i f_i = (10 \times 6) + (15 \times 8) + (20 \times p) + (25 \times 10) + (30 \times 6)$.
$\sum x_i f_i = 60 + 120 + 20p + 250 + 180 = 610 + 20p$.
Given the mean is $20.2$,we set up the equation: $20.2 = \frac{610 + 20p}{30 + p}$.
Multiply both sides by $(30 + p)$: $20.2(30 + p) = 610 + 20p$.
$606 + 20.2p = 610 + 20p$.
Subtract $20p$ from both sides: $606 + 0.2p = 610$.
Subtract $606$ from both sides: $0.2p = 4$.
Divide by $0.2$: $p = \frac{4}{0.2} = 20$.
0 likes
View Solution49
MediumMCQ
Obtain the mean of the following distribution:
| Frequency $(f_i)$ | Variable $(x_i)$ |
| $4$ | $4$ |
| $8$ | $6$ |
| $14$ | $8$ |
| $11$ | $10$ |
| $3$ | $12$ |
A
$7$
B
$8.05$
C
$10.95$
D
$64$
Solution
(B) To find the mean,we use the formula $\bar{x} = \frac{\sum f_i x_i}{\sum f_i}$.
Mean $\bar{x} = \frac{322}{40} = 8.05$.
| Variable $(x_i)$ | Frequency $(f_i)$ | $f_i x_i$ |
| $4$ | $4$ | $16$ |
| $6$ | $8$ | $48$ |
| $8$ | $14$ | $112$ |
| $10$ | $11$ | $110$ |
| $12$ | $3$ | $36$ |
| Total | $\sum f_i = 40$ | $\sum f_i x_i = 322$ |
Mean $\bar{x} = \frac{322}{40} = 8.05$.
0 likes
View Solution50
MediumMCQ
$A$ class consists of $50$ students out of which $30$ are girls. The mean of marks scored by girls in a test is $73$ (out of $100$) and that of boys is $71$. Determine the mean score of the whole class.
A
$70$
B
$73.8$
C
$72.2$
D
$80.5$
Solution
(C) There are $50$ students in a class. Out of these $50$ students,$30$ are girls.
So,the number of boys in the class $= 50 - 30 = 20$.
Mean marks of $30$ girls $= 73$.
Total marks of $30$ girls $= 73 \times 30 = 2190$.
Mean marks of $20$ boys $= 71$.
Total marks of $20$ boys $= 71 \times 20 = 1420$.
Total marks of the whole class $= 2190 + 1420 = 3610$.
Mean score of the whole class $= \frac{\text{Total marks}}{\text{Total students}} = \frac{3610}{50} = 72.2$.
0 likes
View SolutionStatistics — Mix Examples - Statistics and Probability · Frequently Asked Questions
1Are these Statistics questions useful for JEE and NEET?
Yes. All questions in this section are mapped to JEE Main and NEET exam patterns. Previous year questions from JEE Main, NEET, GUJCET and state-level exams are included with full solutions.
2Can I switch to Hindi or Gujarati for these questions?
Yes. Use the language tabs in the hero section or the sidebar to view the same questions and solutions in English, Hindi or Gujarati.
3How do I generate a question paper from this subtopic?
Use the Vedclass Exam Paper Generator — select the chapter and subtopic, set difficulty, and generate Sets A, B, C, D automatically. First 3 chapters of every subject are free.
Vedclass Products
For Students
Vedclass Test Series
Mock tests in real JEE/NEET style with performance analysis. 5-day free trial.
Start Free TrialFor Teachers
Exam Paper Generator
Generate Set A/B/C/D papers from this chapter in 2 minutes. 3 chapters free.
Try FreeFor Institutes
Online Exam Module
Live online exams with unlimited students, 360° analytics & white-label branding.
See DemoFor Teachers & Institutes
Generate a Statistics Exam Paper in 2 Minutes
Select subtopic & difficulty — Sets A, B, C, D auto-generated with No Repeat logic.
First 3 chapters of every subject are free — no payment required.