
Medium
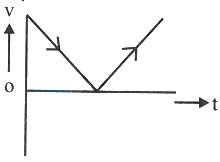
Among the following,the velocity $(v)$ - time $(t)$ graph representing the motion of a vertically projected body is
- A
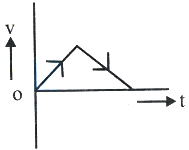
- B
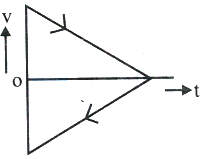
- C
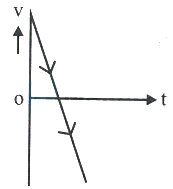
- D
Explore More
Similar Questions
The $x - t$ graph shown in the figure represents:
Medium
View SolutionWhich of the following velocity-time graphs shows a realistic situation for a body in motion?
$A$ train starting from rest accelerates uniformly for $100\,s,$ then comes to a stop with a uniform retardation in the next $200\,s.$ During the motion,it covers a distance of $3\,km.$ Choose the wrong option.
Medium
View SolutionThe displacement $x$ versus time graph is shown below. Analyze the following statements:
$(A)$ The average velocity during $0$ to $3\ s$ is $10\ m/s$.
$(B)$ The average velocity during $3$ to $5\ s$ is $0\ m/s$.
$(C)$ The instantaneous velocity at $t = 2\ s$ is $5\ m/s$.
$(D)$ The average velocity during $5$ to $7\ s$ and instantaneous velocity at $t = 6.5\ s$ are equal.
$(E)$ The average velocity from $t = 0$ to $t = 9\ s$ is zero.
Choose the correct answer from the options given below.
The position $x$ of a particle with respect to time $t$ along the $x$-axis is given by $x = 9t^2 - t^3$,where $x$ is in metres and $t$ is in seconds. What will be the position of this particle when it achieves maximum speed along the $x$-direction?
MediumAIPMT 2007
View SolutionVedclass Products
For Students
Vedclass Test Series
Mock tests in real JEE/NEET style with performance analysis. 5-day free trial.
Start Free TrialFor Teachers
Exam Paper Generator
Generate Set A/B/C/D exam papers from 7.5L+ questions in 2 minutes. 3 chapters free.
Try FreeFor Institutes
Online Exam Module
Live online exams with unlimited students, 360° analytics & white-label branding.
See Demo