
Difficult
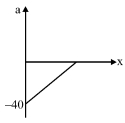
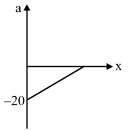
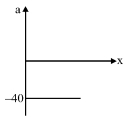
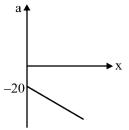
The given graph shows the variation of velocity with displacement. Which one of the graphs given below correctly represents the variation of acceleration with displacement?
- A
- B
- C
- D
Explore More
Similar Questions
$A$ steel ball is released from rest a distance above a rigid horizontal surface and bounces several times. The diagram shows how its velocity varies with time. Which statement correctly explains why the areas $X$ and $Y$ are equal?
Difficult
View Solution$A$ car accelerates from rest at a constant rate $\alpha$ for some time after which it decelerates at a constant rate $\beta$ to come to rest. If the total time elapsed is $t$ seconds,the total distance travelled is
DifficultJEE MAIN 2021
View Solution$A$ particle moves along the $x$-axis in such a way that its $x$-coordinate varies with time according to the equation $x = 4 - 2t + t^2$. The velocity of the particle will vary with time as:
Medium
View SolutionThe velocity $(v)$ and time $(t)$ graph of a body in a straight line motion is shown in the figure. The point $S$ is at $4.333 \; s$. The total distance covered by the body in $6 \; s$ is $....... \; m$.
$A$ bird flies for $4 \, s$ with a velocity of $|t - 2| \, m/s$ in a straight line,where $t$ is time in seconds. It covers a distance of ......... $m$.
Medium
View SolutionVedclass Products
For Students
Vedclass Test Series
Mock tests in real JEE/NEET style with performance analysis. 5-day free trial.
Start Free TrialFor Teachers
Exam Paper Generator
Generate Set A/B/C/D exam papers from 7.5L+ questions in 2 minutes. 3 chapters free.
Try FreeFor Institutes
Online Exam Module
Live online exams with unlimited students, 360° analytics & white-label branding.
See Demo