
The given graph shows the variation of velocity $(v)$ with position $(x)$ for a particle moving along a straight line. Which of the following graphs shows the variation of acceleration $(a)$ with position $(x)$?
- A
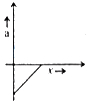
- B
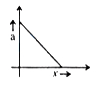
- C
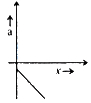
- D

Explore More
Similar Questions
For the following velocity-time graph, the average speed for the motion during first $80 \, s$ is
$A$ train starting from rest travels the first part of its journey with constant acceleration $a$,the second part with constant velocity $v$,and the third part with constant retardation $a$,finally being brought to rest. The average speed for the whole journey is $\frac{7v}{8}$. The train travels with constant velocity for what fraction of the total time?
Medium
View SolutionWhich one of the following graphs for a body moving along a straight line is possible?
Easy
View SolutionSuggest a suitable physical situation for the following $x-t$ graph.
Easy
View SolutionThe graph of displacement $s$ versus time $t$ is given below. Its corresponding velocity-time graph will be:
Medium
View SolutionVedclass Products
For Students
Vedclass Test Series
Mock tests in real JEE/NEET style with performance analysis. 5-day free trial.
Start Free TrialFor Teachers
Exam Paper Generator
Generate Set A/B/C/D exam papers from 7.5L+ questions in 2 minutes. 3 chapters free.
Try FreeFor Institutes
Online Exam Module
Live online exams with unlimited students, 360° analytics & white-label branding.
See Demo