
A English
Stress Strain relationship and Graphical analysis Questions in English
Class 11 Physics · Mechanical Properties of Solids · Stress Strain relationship and Graphical analysis
31+
Questions
English
Language
100%
With Solutions
Showing 30 of 31 questions in English
1
EasyMCQ
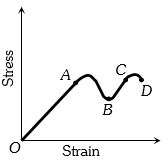
$A$ stress-strain graph for a metal is shown. The part in which Hooke's law holds good is
A
$OA$
B
$AB$
C
$BC$
D
$CD$
Solution
(A) Hooke's law states that within the limit of proportionality,stress is directly proportional to strain.
In the given stress-strain graph,the region $OA$ is a straight line passing through the origin,which indicates that stress is directly proportional to strain in this region.
Therefore,Hooke's law holds good in the part $OA$.
In the given stress-strain graph,the region $OA$ is a straight line passing through the origin,which indicates that stress is directly proportional to strain in this region.
Therefore,Hooke's law holds good in the part $OA$.
0 likes
View Solution2
EasyMCQ
In the below graph,point $B$ indicates
A
Breaking point
B
Limiting point
C
Yield point
D
None of the above
Solution
(C) In the stress-strain curve for a material,the point $B$ represents the yield point.
At this point,the material begins to deform plastically,meaning it will not return to its original shape even after the applied stress is removed.
Beyond this point,the material undergoes permanent deformation.
At this point,the material begins to deform plastically,meaning it will not return to its original shape even after the applied stress is removed.
Beyond this point,the material undergoes permanent deformation.
0 likes
View Solution3
EasyMCQ
In the given stress-strain graph,what does point $D$ indicate?
A
Limiting point
B
Yield point
C
Breaking point
D
None of the above
Solution
(C) In a typical stress-strain curve for a material,the graph represents the behavior of the material under an increasing load.
Point $A$ typically represents the limit of proportionality.
Point $B$ represents the yield point.
Point $C$ represents the ultimate tensile strength.
Point $D$ is the final point on the curve where the material fractures or fails,which is known as the breaking point or fracture point.
Therefore,point $D$ indicates the breaking point.
0 likes
View Solution4
MediumMCQ
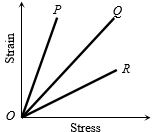
The strain-stress curves of three wires of different materials are shown in the figure. $P, Q$ and $R$ are the elastic limits of the wires. The figure shows that
A
Elasticity of wire $P$ is maximum
B
Elasticity of wire $Q$ is maximum
C
Tensile strength of $R$ is maximum
D
None of the above is true
Solution
(D) In the given graph,stress is plotted on the $x$-axis and strain is plotted on the $y$-axis.
Young's modulus $Y$ is defined as the ratio of stress to strain,i.e.,$Y = \frac{\text{stress}}{\text{strain}}$.
From the graph,the slope of the line is $\text{slope} = \frac{\text{strain}}{\text{stress}} = \frac{1}{Y}$.
Therefore,$Y = \frac{1}{\text{slope}}$.
Since the slope of line $P$ is the greatest,its Young's modulus $Y$ is the smallest.
Since the slope of line $R$ is the smallest,its Young's modulus $Y$ is the greatest.
Thus,the elasticity of wire $R$ is maximum and that of wire $P$ is minimum.
Comparing this with the given options,options $A$,$B$,and $C$ are incorrect.
Therefore,the correct option is $D$.
0 likes
View Solution5
MediumMCQ
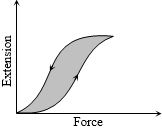
The diagram shows a force-extension graph for a rubber band. Consider the following statements:
$I.$ It will be easier to compress this rubber than expand it.
$II.$ Rubber does not return to its original length after it is stretched.
$III.$ The rubber band will get heated if it is stretched and released.
Which of these can be deduced from the graph?
$I.$ It will be easier to compress this rubber than expand it.
$II.$ Rubber does not return to its original length after it is stretched.
$III.$ The rubber band will get heated if it is stretched and released.
Which of these can be deduced from the graph?
A
$III$ only
B
$II$ and $III$
C
$I$ and $III$
D
$I$ only
Solution
(A) The graph shows a hysteresis loop for a rubber band.
$1.$ Statement $I$ is incorrect because the graph only shows extension under a tensile force,not compression.
$2.$ Statement $II$ is incorrect because the graph starts and ends at the origin $(0,0)$,indicating that the rubber band returns to its original length after the force is removed.
$3.$ Statement $III$ is correct. The area enclosed by the hysteresis loop represents the energy dissipated as heat during one complete cycle of stretching and unstretching. Therefore,the rubber band will get heated.
0 likes
View Solution6
EasyMCQ
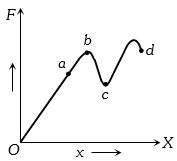
The graph is drawn between the applied force $F$ and the strain $(x)$ for a thin uniform wire. The wire behaves as a liquid in the part:
A
$ab$
B
$bc$
C
$cd$
D
$oa$
Solution
(B) In the stress-strain graph,the region where the material undergoes plastic deformation and flows like a liquid is the region where the strain increases even as the applied force decreases. In the given graph,this corresponds to the part $bc$,where the material exhibits plastic flow.
0 likes
View Solution7
MediumMCQ
The graph shows the behavior of a length of wire in the region for which the substance obeys Hooke's law. $P$ and $Q$ represent:
A
$P =$ applied force,$Q =$ extension
B
$P =$ extension,$Q =$ applied force
C
$P =$ extension,$Q =$ stored elastic energy
D
$P =$ stored elastic energy,$Q =$ extension
Solution
(C) The graph between applied force $(F)$ and extension $(x)$ is a straight line because,according to Hooke's law,$F = kx$,which implies $F \propto x$.
However,the graph between extension $(x)$ and stored elastic potential energy $(U)$ is parabolic in nature.
The formula for stored elastic potential energy is $U = \frac{1}{2} k x^2$,which implies $U \propto x^2$.
Since the given graph is parabolic,$P$ must represent the extension $(x)$ and $Q$ must represent the stored elastic energy $(U)$.
0 likes
View Solution8
MediumMCQ
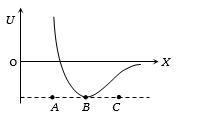
The potential energy $U$ between two molecules as a function of the distance $X$ between them is shown in the figure. The two molecules are
A
Attracted when $x$ lies between $A$ and $B$ and are repelled when $X$ lies between $B$ and $C$
B
Attracted when $x$ lies between $B$ and $C$ and are repelled when $X$ lies between $A$ and $B$
C
Attracted when they reach $B$
D
Repelled when they reach $B$
Solution
(B) The force $F$ between two molecules is related to the potential energy $U$ by the relation $F = -\frac{dU}{dx}$.
In the region $BC$,the slope of the graph $\frac{dU}{dx}$ is positive.
Therefore,$F = -(\text{positive}) = \text{negative}$,which means the force is attractive in nature.
In the region $AB$,the slope of the graph $\frac{dU}{dx}$ is negative.
Therefore,$F = -(\text{negative}) = \text{positive}$,which means the force is repulsive in nature.
Thus,the molecules are attracted when $x$ lies between $B$ and $C$ and are repelled when $X$ lies between $A$ and $B$.
0 likes
View Solution9
EasyMCQ
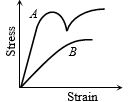
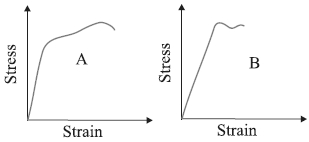
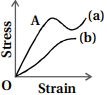
The diagram shows the stress versus strain curve for materials $A$ and $B$. From the curves,we infer that:
A
$A$ is brittle but $B$ is ductile
B
$A$ is ductile and $B$ is brittle
C
Both $A$ and $B$ are ductile
D
Both $A$ and $B$ are brittle
Solution
(B) The stress-strain curve for a ductile material shows a significant plastic region where the material undergoes large deformation before breaking,often showing a yield point.
In contrast,a brittle material breaks shortly after the elastic limit,showing little to no plastic deformation.
Looking at the graph,material $A$ exhibits a clear yield point and a significant plastic region,which is characteristic of a ductile material.
Material $B$ shows a curve that ends abruptly without a significant plastic region or yield point,which is characteristic of a brittle material.
Therefore,$A$ is ductile and $B$ is brittle.
0 likes
View Solution10
MediumMCQ
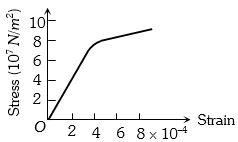
Which one of the following is the Young's modulus (in $N/m^2$) for the wire having the stress-strain curve shown in the figure?
A
$24 \times 10^{11}$
B
$8.0 \times 10^{11}$
C
$10 \times 10^{11}$
D
$2.0 \times 10^{11}$
Solution
(D) Young's modulus $(Y)$ is defined as the ratio of stress to strain within the elastic limit (linear region of the graph).
From the given graph,we select a point in the linear region where stress is $8 \times 10^7 \ N/m^2$ and the corresponding strain is $4 \times 10^{-4}$.
Using the formula $Y = \frac{\text{Stress}}{\text{Strain}}$:
$Y = \frac{8 \times 10^7}{4 \times 10^{-4}}$
$Y = 2 \times 10^{11} \ N/m^2$.
Therefore,the correct option is $(D)$.
0 likes
View Solution11
EasyMCQ
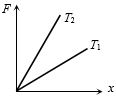
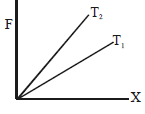
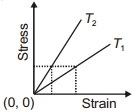
The diagram shows the change $x$ in the length of a thin uniform wire caused by the application of force $F$ at two different temperatures $T_1$ and $T_2$. The variations shown suggest that
A
$T_1 > T_2$
B
$T_1 < T_2$
C
$T_1 = T_2$
D
None of these
Solution
(A) From Hooke's Law,$F = kx$,where $k$ is the force constant of the wire. The slope of the $F-x$ graph is equal to the force constant $k = \frac{YA}{L}$,where $Y$ is Young's modulus,$A$ is the area of cross-section,and $L$ is the length of the wire.
The elasticity (Young's modulus $Y$) of a material generally decreases as the temperature increases.
In the given graph,the slope of the line for $T_2$ is greater than the slope of the line for $T_1$ (i.e.,$\text{slope}_{T_2} > \text{slope}_{T_1}$).
Since a higher slope corresponds to a higher Young's modulus $(Y)$,and a higher $Y$ corresponds to a lower temperature,it follows that $T_2 < T_1$ or $T_1 > T_2$.
0 likes
View Solution12
EasyMCQ
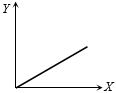
$A$ student plots a graph from his readings on the determination of Young's modulus of a metal wire but forgets to label the axes. The quantities on $X$ and $Y$ axes may be respectively:
A
Weight hung and length increased
B
Stress applied and length increased
C
Stress applied and strain developed
D
Length increased and weight hung
Solution
(C) Young's modulus $(Y)$ is defined as the ratio of stress to strain within the elastic limit,given by the formula $Y = \frac{\text{Stress}}{\text{Strain}}$.
According to Hooke's law,within the elastic limit,stress is directly proportional to strain,i.e.,$\text{Stress} \propto \text{Strain}$.
Therefore,a graph plotted with strain on the $X$-axis and stress on the $Y$-axis (or vice versa,depending on the convention) will result in a straight line passing through the origin.
Among the given options,the most standard representation for the determination of Young's modulus is the stress-strain graph,where stress is plotted on the $Y$-axis and strain on the $X$-axis.
Thus,the quantities on the $X$ and $Y$ axes are strain developed and stress applied,respectively. However,given the options,option $C$ represents the fundamental physical relationship.
0 likes
View Solution13
MediumMCQ
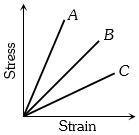
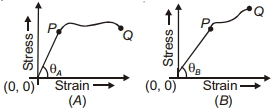
The stress-strain curves for brass,steel,and rubber are shown in the figure. The lines $A, B,$ and $C$ correspond to:
A
Rubber,brass,and steel respectively
B
Brass,steel,and rubber respectively
C
Steel,brass,and rubber respectively
D
Steel,rubber,and brass respectively
Solution
(C) The slope of the stress-strain curve represents the Young's modulus $(Y)$ of the material,where $Y = \tan \theta$.
According to the figure,the angles with the strain axis satisfy the condition $\theta_A > \theta_B > \theta_C$.
Since the tangent function is increasing in the first quadrant,we have $\tan \theta_A > \tan \theta_B > \tan \theta_C$,which implies $Y_A > Y_B > Y_C$.
Comparing the Young's modulus values of the given materials,we know that steel is the most rigid (highest $Y$),followed by brass,and rubber is the least rigid (lowest $Y$).
Therefore,the lines $A, B,$ and $C$ correspond to steel,brass,and rubber respectively.
0 likes
View Solution14
MediumMCQ
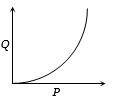
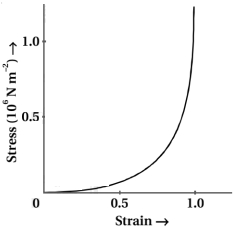
The stress vs. strain curve for the elastic tissue of the aorta,the large tube (vessel) carrying blood from the heart,will be: [Note: Stress is proportional to the square of the strain for the elastic tissue of the aorta.]
A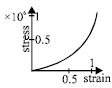
B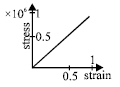
C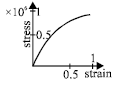
D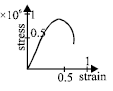
Solution
(A) The problem states that for the elastic tissue of the aorta,stress is proportional to the square of the strain. Mathematically,this is expressed as:
$Stress \propto (Strain)^2$
$Stress = k \cdot (Strain)^2$
where $k$ is a constant.
This equation represents a parabola that opens upwards,starting from the origin $(0,0)$.
As the strain increases,the stress increases at an accelerating rate,which corresponds to the upward-curving graph shown in option $A$.
0 likes
View Solution15
EasyMCQ
The diagram below shows the change in the length $X$ of a thin uniform wire caused by the application of stress $F$ at two different temperatures $T_1$ and $T_2$. The variation shown suggests that
A
$T_1 > T_2$
B
$T_1 < T_2$
C
$T_2 > T_1$
D
$T_1 \geq T_2$
Solution
(A) From Hooke's Law,stress $F = Y \cdot \text{strain} = Y \cdot (X/L)$,where $Y$ is Young's modulus and $L$ is the original length.
Thus,$X = (F \cdot L) / Y$.
The slope of the $F-X$ graph is $F/X = Y/L$.
As temperature increases,the Young's modulus $Y$ of a material generally decreases.
In the given graph,the slope of the line for $T_1$ is less than the slope of the line for $T_2$ (i.e.,$\text{slope}_{T_1} < \text{slope}_{T_2}$).
Since $\text{slope} = Y/L$,this implies $Y_{T_1} < Y_{T_2}$.
Since Young's modulus decreases with an increase in temperature,a lower Young's modulus corresponds to a higher temperature.
Therefore,$T_1 > T_2$.
0 likes
View Solution16
EasyMCQ
The stress-strain curves are drawn for two different materials $X$ and $Y$. It is observed that the ultimate strength point and the fracture point are close to each other for material $X$ but are far apart for material $Y$. We can say that materials $X$ and $Y$ are likely to be (respectively)
A
brittle and ductile
B
ductile and brittle
C
brittle and plastic
D
plastic and ductile
Solution
(A) In a stress-strain curve,the ultimate strength point represents the maximum stress a material can withstand. The fracture point is the point where the material breaks.
For a brittle material,the material breaks soon after the elastic limit or ultimate strength point,meaning the fracture point is very close to the ultimate strength point.
For a ductile material,the material undergoes significant plastic deformation after the ultimate strength point before it finally fractures,meaning the fracture point is far from the ultimate strength point.
Since material $X$ has these points close together,it is brittle.
Since material $Y$ has these points far apart,it is ductile.
Therefore,$X$ and $Y$ are brittle and ductile,respectively.
0 likes
View Solution17
Medium
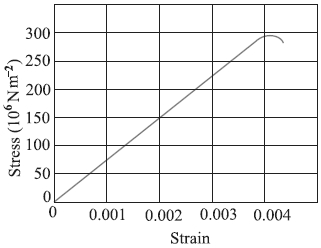
The figure shows the stress-strain curve for a given material. What are $(a)$ Young's modulus and $(b)$ approximate yield strength for this material?
Solution
(N/A) It is clear from the given graph that for a stress of $150 \times 10^{6} \, N/m^{2}$,the strain is $0.002$.
$(a)$ Young's modulus,$Y = \frac{\text{stress}}{\text{strain}}$
$Y = \frac{150 \times 10^{6} \, N/m^{2}}{0.002} = 7.5 \times 10^{10} \, N/m^{2}$
Hence,the Young's modulus for the given material is $7.5 \times 10^{10} \, N/m^{2}$.
$(b)$ The yield strength of a material is the maximum stress that the material can sustain without crossing the elastic limit.
It is clear from the given graph that the approximate yield strength of this material is $300 \times 10^{6} \, N/m^{2}$ or $3 \times 10^{8} \, N/m^{2}$.
0 likes
View Solution18
Medium
The stress-strain graphs for materials $A$ and $B$ are shown in the figure. The graphs are drawn to the same scale.
$(a)$ Which of the materials has the greater Young's modulus?
$(b)$ Which of the two is the stronger material?
$(a)$ Which of the materials has the greater Young's modulus?
$(b)$ Which of the two is the stronger material?
Solution
(A) ; $(b)$ $A$
For a given strain,the stress for material $A$ is greater than it is for material $B$,as shown in the two graphs.
Young's modulus $= \frac{\text{stress}}{\text{strain}}$
For a given strain,if the stress for a material is higher,then Young's modulus is also greater for that material. Therefore,Young's modulus for material $A$ is greater than it is for material $B$.
The strength of a material is determined by the amount of stress required to fracture it,which corresponds to its fracture point. The fracture point is the extreme point in a stress-strain curve. By observing the graphs,the stress at the fracture point for material $A$ is higher than that for material $B$.
Hence,material $A$ is stronger than material $B$.
0 likes
View Solution19
Medium
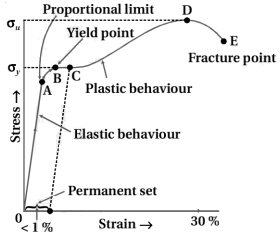
Plot a stress $\to$ strain curve for a metal and explain.
Solution
(N/A) stress $\to$ strain curve for a metal is shown in the figure.
From the graph,we can see that in the region between $O$ to $A$,the curve is linear. In this region,Hooke's law is obeyed.
The body regains its original dimensions when the applied force is removed. In this region,the solid behaves as an elastic body.
In the region from $A$ to $B$,stress and strain are not proportional. The body still returns to its original dimension when the load is removed. The point $B$ in the curve is known as the yield point (also known as the elastic limit) and the corresponding stress is known as the yield strength $(\sigma_{y})$ of the material.
If the load is increased further,from point $B$,the stress developed exceeds the yield strength and strain increases rapidly.
The portion of the curve between $B$ and $D$ shows this; when the load is removed,say at some point $C$ between $B$ and $D$,the body does not regain its original dimension.
In this state,even when the stress is zero,the strain is not zero. The material is said to have a permanent set. The deformation is said to be plastic deformation. The point $D$ on the curve is the ultimate tensile strength $(\sigma_{u})$ of the material. Beyond this point,additional strain is produced even by a reduced applied force and fracture occurs at point $E$.
If the ultimate strength and fracture points $D$ and $E$ are close,the material is said to be brittle. If they are far apart,the material is said to be ductile.
0 likes
View Solution20
Medium
What are elastomers? Plot the stress $\to$ strain curve for them and explain.
Solution
(N/A) Materials that can be stretched to cause large values of strain are called elastomers. Examples include rubber and the elastic tissues of the aorta.
Rubber can be pulled to several times its original length and still returns to its original shape.
The figure shows the stress $\to$ strain curve for the elastic tissue of the aorta,which is the large vessel carrying blood from the heart.
Key observations from the curve:
$1$. The elastic region is very large.
$2$. The material does not obey Hooke's law over most of this region.
$3$. There is no well-defined plastic region for these materials.
0 likes
View Solution21
Medium
In Column-$I$ there are two stress-strain graphs,and in Column-$II$ the nature of the materials is given. Match them appropriately:
| Column-$I$ | Column-$II$ |
| $(a)$ Graph $A$ | $(i)$ $A$ is ductile |
| $(b)$ Graph $B$ | $(ii)$ $A$ is brittle |
| $(iii)$ $B$ is ductile | |
| $(iv)$ $B$ is brittle |
Solution
(A) The stress-strain graph for a material shows its mechanical properties.
$1$. $A$ material is considered ductile if it shows a large plastic deformation range before breaking. Graph $A$ shows a distinct yield point and significant plastic flow,which is characteristic of ductile materials.
$2$. $A$ material is considered brittle if it breaks soon after the elastic limit with very little plastic deformation. Graph $B$ shows a smaller range of plastic deformation compared to $A$,indicating it is more brittle.
Therefore,the correct matching is: $(a-i)$ and $(b-iv)$.
0 likes
View Solution22
MediumMCQ
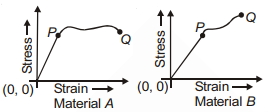
The stress-strain graphs for two materials $A$ and $B$ are shown in the figure. The graphs are drawn to the same scale. Select the correct statement.
A
Material $A$ has a greater Young's Modulus.
B
Material $A$ is ductile.
C
Material $B$ is brittle.
D
All of these.
Solution
(D) The correct option is $(d)$.
$1$. The slope of the stress-strain curve $(\tan \theta)$ gives the value of Young's Modulus $(Y)$ for a given material, i.e., $Y = \tan \theta$.
$2$. From the given graphs, it is clear that $\theta_A > \theta_B$, which implies $\tan \theta_A > \tan \theta_B$. Therefore, material $A$ has a greater Young's Modulus.
$3$. The distance from point $P$ to $Q$ represents the plastic region of the material. The distance $PQ$ in material $A$ is greater than the distance $PQ$ in material $B$, which indicates that material $A$ can undergo more plastic deformation before breaking compared to material $B$.
$4$. Materials that undergo significant plastic deformation before breaking are called ductile, while those that break soon after the elastic limit are called brittle. Thus, material $A$ is ductile and material $B$ is brittle.
Since all the statements are correct, the correct option is $(d)$.
0 likes
View Solution23
MediumMCQ
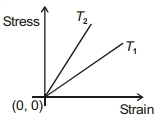
The figure shows the graph between stress and strain for a uniform wire at two different temperatures. Then:
A
$T_2 > T_1$
B
$T_1 > T_2$
C
$T_1 = T_2$
D
None of these
Solution
(B) The Young's modulus $(Y)$ of a material is defined as the ratio of stress to strain,which corresponds to the slope of the stress-strain graph.
From the given graph,the slope of the line for $T_2$ is greater than the slope of the line for $T_1$. Therefore,$Y_{T_2} > Y_{T_1}$.
As the temperature of a material increases,the interatomic forces weaken,causing the material to become more ductile and less stiff,which results in a decrease in the Young's modulus.
Since $Y$ decreases as temperature increases,a higher Young's modulus corresponds to a lower temperature.
Thus,$T_1 > T_2$.
0 likes
View Solution24
EasyMCQ
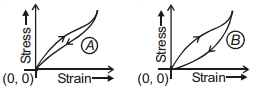
Two different types of rubber are found to have the stress-strain curves as shown. Then:
A
$A$ is suitable for shock absorbers.
B
$B$ is suitable for car tyres.
C
$B$ is suitable for shock absorbers.
D
None of these.
Solution
(C) The area enclosed by the stress-strain hysteresis loop represents the energy dissipated as heat per unit volume during one cycle of loading and unloading.
$1$. Materials with a large hysteresis loop (large area) are suitable for shock absorbers because they can absorb and dissipate a significant amount of mechanical energy,thereby damping vibrations effectively.
$2$. Materials with a small hysteresis loop (small area) are suitable for car tyres because they minimize energy loss as heat,preventing the tyres from overheating during continuous use.
Looking at the provided graphs,the area of the loop for material $B$ is larger than that for material $A$. Therefore,material $B$ is more suitable for shock absorbers,and material $A$ is more suitable for car tyres.
0 likes
View Solution25
MediumMCQ
In plotting stress versus strain curves for two materials $P$ and $Q$,a student by mistake puts strain on the $y$-axis and stress on the $x$-axis as shown in the figure. Then the correct statement$(s)$ is(are):
$(A)$ $P$ has more tensile strength than $Q$
$(B)$ $P$ is more ductile than $Q$
$(C)$ $P$ is more brittle than $Q$
$(D)$ The Young's modulus of $P$ is more than that of $Q$
$(A)$ $P$ has more tensile strength than $Q$
$(B)$ $P$ is more ductile than $Q$
$(C)$ $P$ is more brittle than $Q$
$(D)$ The Young's modulus of $P$ is more than that of $Q$

A
$(A, B)$
B
$(A, C)$
C
$(B, C)$
D
$(B, D)$
Solution
(C) The Young's modulus $Y$ is defined as $Y = \frac{\text{stress}}{\text{strain}}$.
In the given graph,strain is on the $y$-axis and stress is on the $x$-axis. Therefore,the slope of the curve is $\frac{\text{strain}}{\text{stress}} = \frac{1}{Y}$.
Since the slope of material $P$ is greater than the slope of material $Q$,we have $\frac{1}{Y_P} > \frac{1}{Y_Q}$,which implies $Y_P < Y_Q$. Thus,statement $(D)$ is incorrect.
Material $P$ shows a larger strain for a given stress compared to $Q$,indicating that $P$ is more ductile than $Q$. Thus,statement $(B)$ is correct.
Since $P$ is more ductile,it is less brittle than $Q$. Thus,statement $(C)$ is incorrect.
Tensile strength is determined by the maximum stress a material can withstand before breaking. From the graph,$Q$ can withstand more stress than $P$ before the curve ends,so $Q$ has more tensile strength than $P$. Thus,statement $(A)$ is incorrect.
Therefore,only statement $(B)$ is correct. However,based on the provided options,the question implies multiple correct statements. Re-evaluating: $P$ is more ductile ($B$ is correct). Since $P$ is more ductile,it is less brittle. The options provided are combinations. Given the standard interpretation of such problems,$(B)$ is the only physically correct statement.
0 likes
View Solution26
EasyMCQ
Assertion $(A)$: Ductile metals are used to prepare thin wires.
Reason $(R)$: In the stress-strain curve of ductile metals,the length between the points representing elastic limit and breaking point is very small.
Reason $(R)$: In the stress-strain curve of ductile metals,the length between the points representing elastic limit and breaking point is very small.
A
Both $(A)$ and $(R)$ are true and $(R)$ is the correct explanation of $(A)$
B
Both $(A)$ and $(R)$ are true but $(R)$ is not the correct explanation of $(A)$
C
$(A)$ is true but $(R)$ is false
D
$(A)$ is false but $(R)$ is true
Solution
(C) Ductile materials are those that can be drawn into thin wires. This property is due to the large plastic deformation range between the elastic limit and the breaking point.
Therefore,the Assertion $(A)$ is true.
In the stress-strain curve for ductile materials,the region between the elastic limit and the fracture (breaking) point is large,which allows for significant elongation before the material breaks.
The Reason $(R)$ states that this length is very small,which is incorrect.
Thus,$(A)$ is true but $(R)$ is false.
0 likes
View Solution27
MediumMCQ
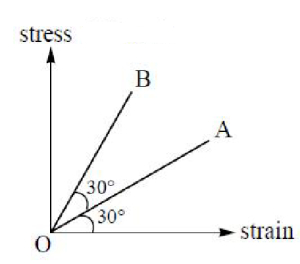
The stress-strain graph of two wires $A$ and $B$ is shown in the figure. If $Y_{A}$ and $Y_B$ are Young's moduli of materials of wires $A$ and $B$ respectively, then
A
$Y_{A}=3 Y_{B}$
B
$Y_A=Y_B$
C
$Y_{B}=3 Y_{A}$
D
$Y_B=2 Y_A$
Solution
(C) The Young's modulus $Y$ is defined as the ratio of stress to strain, which corresponds to the slope of the stress-strain graph.
$Y = \text{slope} = \tan(\theta)$, where $\theta$ is the angle the line makes with the strain axis.
For wire $A$, the angle with the strain axis is $\theta_A = 30^{\circ}$.
Therefore, $Y_A = \tan(30^{\circ}) = \frac{1}{\sqrt{3}}$.
For wire $B$, the angle with the strain axis is $\theta_B = 30^{\circ} + 30^{\circ} = 60^{\circ}$.
Therefore, $Y_B = \tan(60^{\circ}) = \sqrt{3}$.
Now, calculating the ratio $\frac{Y_B}{Y_A} = \frac{\sqrt{3}}{1/\sqrt{3}} = 3$.
Thus, $Y_B = 3 Y_A$.
0 likes
View Solution28
EasyMCQ
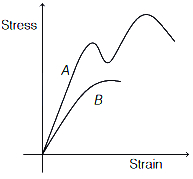
The diagram shows the stress versus strain curve for materials $A$ and $B$. From the curves,we can infer that
A
$A$ is brittle but $B$ is ductile
B
$A$ is ductile but $B$ is brittle
C
Both $A$ and $B$ are ductile
D
Both $A$ and $B$ are brittle
Solution
(B) In a stress-strain curve,a material that shows a large plastic deformation before breaking is called ductile,while a material that breaks soon after the elastic limit is called brittle.
From the given graph,material $A$ shows a significant plastic region (indicated by the curve extending further and showing a yield point) before fracture,which is a characteristic of ductile materials.
Material $B$ shows a smaller region of deformation and breaks relatively quickly after the elastic limit,which is a characteristic of brittle materials.
Therefore,$A$ is ductile and $B$ is brittle.
0 likes
View Solution29
EasyMCQ
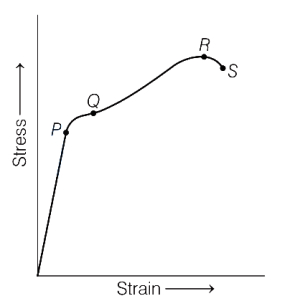
The graph below represents a typical stress-strain curve for a metal. Identify the point on the graph that is the ultimate tensile strength of the material.
A
$P$
B
$Q$
C
$R$
D
$S$
Solution
(C) In a typical stress-strain curve for a metal:
$P$ represents the limit of proportionality.
$Q$ represents the elastic limit (or yield point).
$R$ represents the ultimate tensile strength,which is the maximum stress the material can withstand before it begins to neck.
$S$ represents the fracture or breaking point.
Therefore,point $R$ corresponds to the ultimate tensile strength of the material.
0 likes
View Solution30
MediumMCQ
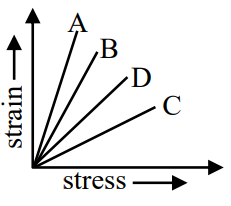
The strain-stress plot for materials $A$,$B$,$C$ and $D$ is shown in the figure. Which material has the largest Young's modulus?
A
$C$
B
$D$
C
$A$
D
$B$
Solution
(A) Young's modulus $(Y)$ is defined as the ratio of stress to strain: $Y = \frac{\text{Stress}}{\text{Strain}}$.
In the given graph,strain is plotted on the $y$-axis and stress is plotted on the $x$-axis.
Therefore,the slope of the graph is $\text{Slope} = \frac{\text{Strain}}{\text{Stress}} = \frac{1}{Y}$.
To have the largest Young's modulus $(Y)$,the value of $\frac{1}{Y}$ must be the smallest.
This means the slope of the strain-stress graph should be the minimum.
Looking at the figure,material $C$ has the smallest slope.
Thus,material $C$ has the largest Young's modulus.
0 likes
View SolutionMechanical Properties of Solids — Stress Strain relationship and Graphical analysis · Frequently Asked Questions
1Are these Mechanical Properties of Solids questions useful for JEE and NEET?
Yes. All questions in this section are mapped to JEE Main and NEET exam patterns. Previous year questions from JEE Main, NEET, GUJCET and state-level exams are included with full solutions.
2Can I switch to Hindi or Gujarati for these questions?
Yes. Use the language tabs in the hero section or the sidebar to view the same questions and solutions in English, Hindi or Gujarati.
3How do I generate a question paper from this subtopic?
Use the Vedclass Exam Paper Generator — select the chapter and subtopic, set difficulty, and generate Sets A, B, C, D automatically. First 3 chapters of every subject are free.
Vedclass Products
For Students
Vedclass Test Series
Mock tests in real JEE/NEET style with performance analysis. 5-day free trial.
Start Free TrialFor Teachers
Exam Paper Generator
Generate Set A/B/C/D papers from this chapter in 2 minutes. 3 chapters free.
Try FreeFor Institutes
Online Exam Module
Live online exams with unlimited students, 360° analytics & white-label branding.
See DemoFor Teachers & Institutes
Generate a Mechanical Properties of Solids Exam Paper in 2 Minutes
Select subtopic & difficulty — Sets A, B, C, D auto-generated with No Repeat logic.
First 3 chapters of every subject are free — no payment required.