
A English
Textbook - Statistics Questions in English
Class 10 Mathematics · Statistics · Textbook - Statistics
34+
Questions
English
Language
100%
With Solutions
Showing 34 of 34 questions in English
1
EasyMCQ
The marks obtained by $30$ students of Class $X$ of a certain school in a Mathematics paper consisting of $100$ marks are presented in the table below. Find the mean of the marks obtained by the students.
| Marks obtained $(x_{i})$ | $10, 20, 36, 40, 50, 56, 60, 70, 72, 80, 88, 92, 95$ |
| Number of students $(f_{i})$ | $1, 1, 3, 4, 3, 2, 4, 4, 1, 1, 2, 3, 1$ |
A
$59.3$
B
$63.2$
C
$54.5$
D
$55.5$
Solution
(A) To find the mean marks,we calculate the product of each mark $(x_{i})$ with its corresponding frequency $(f_{i})$.
The mean $\bar{x}$ is given by the formula:
$\bar{x} = \frac{\Sigma f_{i}x_{i}}{\Sigma f_{i}} = \frac{1779}{30} = 59.3$
Therefore,the mean marks obtained by the students is $59.3$.
| Marks obtained $(x_{i})$ | Number of students $(f_{i})$ | $f_{i}x_{i}$ |
| $10$ | $1$ | $10$ |
| $20$ | $1$ | $20$ |
| $36$ | $3$ | $108$ |
| $40$ | $4$ | $160$ |
| $50$ | $3$ | $150$ |
| $56$ | $2$ | $112$ |
| $60$ | $4$ | $240$ |
| $70$ | $4$ | $280$ |
| $72$ | $1$ | $72$ |
| $80$ | $1$ | $80$ |
| $88$ | $2$ | $176$ |
| $92$ | $3$ | $276$ |
| $95$ | $1$ | $95$ |
| Total | $\Sigma f_{i} = 30$ | $\Sigma f_{i}x_{i} = 1779$ |
The mean $\bar{x}$ is given by the formula:
$\bar{x} = \frac{\Sigma f_{i}x_{i}}{\Sigma f_{i}} = \frac{1779}{30} = 59.3$
Therefore,the mean marks obtained by the students is $59.3$.
1 likes
View Solution2
MediumMCQ
The table below gives the percentage distribution of female teachers in the primary schools of rural areas of various states and union territories $(U.T.)$ of India. Find the mean percentage of female teachers by all the three methods discussed in this section.
| Percentage of female teachers | $15$-$25$ | $25$-$35$ | $35$-$45$ | $45$-$55$ | $55$-$65$ | $65$-$75$ | $75$-$85$ |
| Number of States/$U$.$T$. | $6$ | $11$ | $7$ | $4$ | $4$ | $2$ | $1$ |
A
$45.78$
B
$39.71$
C
$56.5$
D
$47.30$
Solution
(B) To find the mean,we first determine the class marks $(x_i)$ for each interval.
Let the assumed mean $a = 50$ and class size $h = 10$. Then $d_i = x_i - 50$ and $u_i = \frac{x_i - 50}{10}$.
From the table,we have $\Sigma f_i = 35, \Sigma f_i x_i = 1390, \Sigma f_i d_i = -360, \Sigma f_i u_i = -36$.
$1$. Direct Method: $\bar{x} = \frac{\Sigma f_i x_i}{\Sigma f_i} = \frac{1390}{35} \approx 39.71$.
$2$. Assumed Mean Method: $\bar{x} = a + \frac{\Sigma f_i d_i}{\Sigma f_i} = 50 + \frac{-360}{35} = 50 - 10.29 = 39.71$.
$3$. Step-deviation Method: $\bar{x} = a + \left(\frac{\Sigma f_i u_i}{\Sigma f_i}\right) \times h = 50 + \left(\frac{-36}{35}\right) \times 10 = 50 - 10.29 = 39.71$.
The mean percentage of female teachers is $39.71$.
Let the assumed mean $a = 50$ and class size $h = 10$. Then $d_i = x_i - 50$ and $u_i = \frac{x_i - 50}{10}$.
| Percentage of female teachers | Number of states/$U$.$T$. $(f_i)$ | $x_i$ | $d_i = x_i - 50$ | $u_i = \frac{x_i - 50}{10}$ | $f_i x_i$ | $f_i d_i$ | $f_i u_i$ |
| $15$-$25$ | $6$ | $20$ | -$30$ | -$3$ | $120$ | -$180$ | -$18$ |
| $25$-$35$ | $11$ | $30$ | -$20$ | -$2$ | $330$ | -$220$ | -$22$ |
| $35$-$45$ | $7$ | $40$ | -$10$ | -$1$ | $280$ | -$70$ | -$7$ |
| $45$-$55$ | $4$ | $50$ | $0$ | $0$ | $200$ | $0$ | $0$ |
| $55$-$65$ | $4$ | $60$ | $10$ | $1$ | $240$ | $40$ | $4$ |
| $65$-$75$ | $2$ | $70$ | $20$ | $2$ | $140$ | $40$ | $4$ |
| $75$-$85$ | $1$ | $80$ | $30$ | $3$ | $80$ | $30$ | $3$ |
| Total | $35$ | - | - | - | $1390$ | -$360$ | -$36$ |
From the table,we have $\Sigma f_i = 35, \Sigma f_i x_i = 1390, \Sigma f_i d_i = -360, \Sigma f_i u_i = -36$.
$1$. Direct Method: $\bar{x} = \frac{\Sigma f_i x_i}{\Sigma f_i} = \frac{1390}{35} \approx 39.71$.
$2$. Assumed Mean Method: $\bar{x} = a + \frac{\Sigma f_i d_i}{\Sigma f_i} = 50 + \frac{-360}{35} = 50 - 10.29 = 39.71$.
$3$. Step-deviation Method: $\bar{x} = a + \left(\frac{\Sigma f_i u_i}{\Sigma f_i}\right) \times h = 50 + \left(\frac{-36}{35}\right) \times 10 = 50 - 10.29 = 39.71$.
The mean percentage of female teachers is $39.71$.
0 likes
View Solution3
MediumMCQ
The distribution below shows the number of wickets taken by bowlers in one-day cricket matches. Find the mean number of wickets by choosing a suitable method. What does the mean signify?
| Number of wickets | $20$-$60$ | $60$-$100$ | $100$-$150$ | $150$-$250$ | $250$-$350$ | $350$-$450$ |
| Number of bowlers | $7$ | $5$ | $16$ | $12$ | $2$ | $3$ |
A
$100.56$
B
$136.50$
C
$152.89$
D
$185.60$
Solution
(C) To find the mean,we first calculate the class marks $(x_i)$ for each interval.
The mean $\bar{x} = \frac{\sum f_i x_i}{\sum f_i} = \frac{6880}{45} \approx 152.89$.
This mean signifies that,on average,the bowlers have taken $152.89$ wickets in the given one-day cricket matches.
| Number of wickets | Number of bowlers $(f_i)$ | Class mark $(x_i)$ | $f_i x_i$ |
| $20$-$60$ | $7$ | $40$ | $280$ |
| $60$-$100$ | $5$ | $80$ | $400$ |
| $100$-$150$ | $16$ | $125$ | $2000$ |
| $150$-$250$ | $12$ | $200$ | $2400$ |
| $250$-$350$ | $2$ | $300$ | $600$ |
| $350$-$450$ | $3$ | $400$ | $1200$ |
| Total | $\sum f_i = 45$ | $\sum f_i x_i = 6880$ |
The mean $\bar{x} = \frac{\sum f_i x_i}{\sum f_i} = \frac{6880}{45} \approx 152.89$.
This mean signifies that,on average,the bowlers have taken $152.89$ wickets in the given one-day cricket matches.
0 likes
View Solution4
MediumMCQ
$A$ survey was conducted by a group of students as a part of their environment awareness programme,in which they collected the following data regarding the number of plants in $20$ houses in a locality. Find the mean number of plants per house.
Which method did you use for finding the mean,and why?
| Number of plants | $0-2$ | $2-4$ | $4-6$ | $6-8$ | $8-10$ | $10-12$ | $12-14$ |
| Number of houses | $1$ | $2$ | $1$ | $5$ | $6$ | $2$ | $3$ |
Which method did you use for finding the mean,and why?
A
$6.9$
B
$9.0$
C
$7.8$
D
$8.1$
Solution
(D) To find the class mark $(x_i)$ for each interval,the following relation is used:
Class mark $(x_i) = \frac{\text{Upper class limit} + \text{Lower class limit}}{2}$
The values of $x_i$ and $f_ix_i$ are calculated as follows:
From the table,we have $\sum f_i = 20$ and $\sum f_ix_i = 162$.
The mean $\bar{x}$ is given by $\bar{x} = \frac{\sum f_ix_i}{\sum f_i}$.
Mean $= \frac{162}{20} = 8.1$.
Therefore,the mean number of plants per house is $8.1$.
The direct method is used here because the numerical values of $x_i$ and $f_i$ are small,making the calculations simple.
Class mark $(x_i) = \frac{\text{Upper class limit} + \text{Lower class limit}}{2}$
The values of $x_i$ and $f_ix_i$ are calculated as follows:
| Number of plants | Number of houses $(f_i)$ | $x_i$ | $f_ix_i$ |
| $0-2$ | $1$ | $1$ | $1 \times 1 = 1$ |
| $2-4$ | $2$ | $3$ | $2 \times 3 = 6$ |
| $4-6$ | $1$ | $5$ | $1 \times 5 = 5$ |
| $6-8$ | $5$ | $7$ | $5 \times 7 = 35$ |
| $8-10$ | $6$ | $9$ | $6 \times 9 = 54$ |
| $10-12$ | $2$ | $11$ | $2 \times 11 = 22$ |
| $12-14$ | $3$ | $13$ | $3 \times 13 = 39$ |
| Total | $\sum f_i = 20$ | $\sum f_ix_i = 162$ |
From the table,we have $\sum f_i = 20$ and $\sum f_ix_i = 162$.
The mean $\bar{x}$ is given by $\bar{x} = \frac{\sum f_ix_i}{\sum f_i}$.
Mean $= \frac{162}{20} = 8.1$.
Therefore,the mean number of plants per house is $8.1$.
The direct method is used here because the numerical values of $x_i$ and $f_i$ are small,making the calculations simple.
0 likes
View Solution5
MediumMCQ
Consider the following distribution of daily wages of $50$ workers of a factory.
$\begin{array}{|l|c|c|c|c|c|} \hline \text{Daily wages (in Rs.)} & 100-120 & 120-140 & 140-160 & 160-180 & 180-200 \\ \hline \text{Number of workers} & 12 & 14 & 8 & 6 & 10 \\ \hline \end{array}$
Find the mean daily wages of the workers of the factory by using an appropriate method.
$\begin{array}{|l|c|c|c|c|c|} \hline \text{Daily wages (in Rs.)} & 100-120 & 120-140 & 140-160 & 160-180 & 180-200 \\ \hline \text{Number of workers} & 12 & 14 & 8 & 6 & 10 \\ \hline \end{array}$
Find the mean daily wages of the workers of the factory by using an appropriate method.
A
$145.20$
B
$149.30$
C
$146.50$
D
$143.60$
Solution
(A) To find the class mark $(x_i)$ for each interval,the following relation is used:
$x_i = \frac{\text{Upper class limit} + \text{Lower class limit}}{2}$
Class size $(h)$ of this data $= 20$.
Taking $150$ as the assumed mean $(a)$,$d_i$,$u_i$,and $f_i u_i$ can be calculated as follows:
$\begin{array}{|c|c|c|c|c|c|} \hline \text{Daily wages} & f_i & x_i & d_i = x_i - 150 & u_i = \frac{d_i}{20} & f_i u_i \\ \hline 100-120 & 12 & 110 & -40 & -2 & -24 \\ \hline 120-140 & 14 & 130 & -20 & -1 & -14 \\ \hline 140-160 & 8 & 150 & 0 & 0 & 0 \\ \hline 160-180 & 6 & 170 & 20 & 1 & 6 \\ \hline 180-200 & 10 & 190 & 40 & 2 & 20 \\ \hline \text{Total} & 50 & & & & -12 \\ \hline \end{array}$
From the table,we have:
$\sum f_i = 50$
$\sum f_i u_i = -12$
Using the step-deviation method,the mean $\bar{x}$ is given by:
$\bar{x} = a + \left( \frac{\sum f_i u_i}{\sum f_i} \right) \times h$
$\bar{x} = 150 + \left( \frac{-12}{50} \right) \times 20$
$\bar{x} = 150 - \frac{240}{50} = 150 - 4.8$
$\bar{x} = 145.2$
Therefore,the mean daily wage of the workers is $Rs. 145.20$.
1 likes
View Solution6
DifficultMCQ
The following distribution shows the daily pocket allowance of children of a locality. The mean pocket allowance is $Rs. 18$. Find the missing frequency $f$.
| Daily pocket allowance (in $Rs.$) | $11-13$ | $13-15$ | $15-17$ | $17-19$ | $19-21$ | $21-23$ | $23-25$ |
| Number of children | $7$ | $6$ | $9$ | $13$ | $f$ | $5$ | $4$ |
A
$10$
B
$20$
C
$30$
D
$40$
Solution
(B) To find the class mark $(x_{i})$ for each interval,the following relation is used:
$x_{i} = \frac{\text{Upper class limit} + \text{Lower class limit}}{2}$
Given that,mean pocket allowance,$\bar{x} = Rs. 18$.
Taking $18$ as assumed mean $(a)$,$d_{i}$ and $f_{i}d_{i}$ are calculated as follows:
From the table,we obtain:
$\sum f_{i} = 44 + f$
$\sum f_{i}d_{i} = 2f - 40$
Using the formula for mean:
$\bar{x} = a + \frac{\sum f_{i}d_{i}}{\sum f_{i}}$
$18 = 18 + \left(\frac{2f - 40}{44 + f}\right)$
$0 = \frac{2f - 40}{44 + f}$
$2f - 40 = 0$
$2f = 40$
$f = 20$
Hence,the missing frequency $f$ is $20$.
$x_{i} = \frac{\text{Upper class limit} + \text{Lower class limit}}{2}$
Given that,mean pocket allowance,$\bar{x} = Rs. 18$.
Taking $18$ as assumed mean $(a)$,$d_{i}$ and $f_{i}d_{i}$ are calculated as follows:
| Daily pocket allowance (in $Rs.$) | Number of children $(f_{i})$ | Class mark $(x_{i})$ | $d_{i} = x_{i} - 18$ | $f_{i}d_{i}$ |
| $11-13$ | $7$ | $12$ | $-6$ | $-42$ |
| $13-15$ | $6$ | $14$ | $-4$ | $-24$ |
| $15-17$ | $9$ | $16$ | $-2$ | $-18$ |
| $17-19$ | $13$ | $18$ | $0$ | $0$ |
| $19-21$ | $f$ | $20$ | $2$ | $2f$ |
| $21-23$ | $5$ | $22$ | $4$ | $20$ |
| $23-25$ | $4$ | $24$ | $6$ | $24$ |
| Total | $\sum f_{i} = 44 + f$ | $\sum f_{i}d_{i} = 2f - 40$ |
From the table,we obtain:
$\sum f_{i} = 44 + f$
$\sum f_{i}d_{i} = 2f - 40$
Using the formula for mean:
$\bar{x} = a + \frac{\sum f_{i}d_{i}}{\sum f_{i}}$
$18 = 18 + \left(\frac{2f - 40}{44 + f}\right)$
$0 = \frac{2f - 40}{44 + f}$
$2f - 40 = 0$
$2f = 40$
$f = 20$
Hence,the missing frequency $f$ is $20$.
0 likes
View Solution7
DifficultMCQ
Thirty women were examined in a hospital by a doctor and the number of heartbeats per minute were recorded and summarized as follows. Find the mean heartbeats per minute for these women,choosing a suitable method.
| Number of heartbeats per minute | $65$-$68$ | $68$-$71$ | $71$-$74$ | $74$-$77$ | $77$-$80$ | $80$-$83$ | $83$-$86$ |
| Number of women | $2$ | $4$ | $3$ | $8$ | $7$ | $4$ | $2$ |
A
$78.9$
B
$77.5$
C
$75.9$
D
$72.3$
Solution
(C) To find the class mark $(x_i)$ of each interval,the following formula is used:
$x_i = \frac{\text{Upper class limit} + \text{Lower class limit}}{2}$
The class size $(h)$ of this data is $3$.
Taking $75.5$ as the assumed mean $(a)$,we calculate $d_i, u_i,$ and $f_i u_i$ as follows:
From the table,we have $\sum f_i = 30$ and $\sum f_i u_i = 4$.
The mean $\bar{x}$ is calculated using the step-deviation method:
$\bar{x} = a + \left( \frac{\sum f_i u_i}{\sum f_i} \right) \times h$
$\bar{x} = 75.5 + \left( \frac{4}{30} \right) \times 3$
$\bar{x} = 75.5 + 0.4 = 75.9$
Therefore,the mean heartbeats per minute for these women is $75.9$.
$x_i = \frac{\text{Upper class limit} + \text{Lower class limit}}{2}$
The class size $(h)$ of this data is $3$.
Taking $75.5$ as the assumed mean $(a)$,we calculate $d_i, u_i,$ and $f_i u_i$ as follows:
| Number of heartbeats per minute | Number of women $(f_i)$ | $x_i$ | $d_i = x_i - 75.5$ | $u_i = \frac{d_i}{3}$ | $f_i u_i$ |
| $65$-$68$ | $2$ | $66.5$ | -$9$ | -$3$ | -$6$ |
| $68$-$71$ | $4$ | $69.5$ | -$6$ | -$2$ | -$8$ |
| $71$-$74$ | $3$ | $72.5$ | -$3$ | -$1$ | -$3$ |
| $74$-$77$ | $8$ | $75.5$ | $0$ | $0$ | $0$ |
| $77$-$80$ | $7$ | $78.5$ | $3$ | $1$ | $7$ |
| $80$-$83$ | $4$ | $81.5$ | $6$ | $2$ | $8$ |
| $83$-$86$ | $2$ | $84.5$ | $9$ | $3$ | $6$ |
| Total | $30$ | - | - | - | $4$ |
From the table,we have $\sum f_i = 30$ and $\sum f_i u_i = 4$.
The mean $\bar{x}$ is calculated using the step-deviation method:
$\bar{x} = a + \left( \frac{\sum f_i u_i}{\sum f_i} \right) \times h$
$\bar{x} = 75.5 + \left( \frac{4}{30} \right) \times 3$
$\bar{x} = 75.5 + 0.4 = 75.9$
Therefore,the mean heartbeats per minute for these women is $75.9$.
0 likes
View Solution8
DifficultMCQ
In a retail market,fruit vendors were selling mangoes kept in packing boxes. These boxes contained varying numbers of mangoes. The following was the distribution of mangoes according to the number of boxes.
Find the mean number of mangoes kept in a packing box. Which method of finding the mean did you choose?
| Number of mangoes | $50$-$52$ | $53$-$55$ | $56$-$58$ | $59$-$61$ | $62$-$64$ |
| Number of boxes | $15$ | $110$ | $135$ | $115$ | $25$ |
Find the mean number of mangoes kept in a packing box. Which method of finding the mean did you choose?
A
$48.60$
B
$60$
C
$55.23$
D
$57.19$
Solution
(D) The class intervals are not continuous. The gap between two consecutive class intervals is $1$. To make them continuous,we subtract $0.5$ from the lower limit and add $0.5$ to the upper limit of each class.
Here,$\sum f_i = 400$,$\sum f_i u_i = 25$,assumed mean $a = 57$,and class size $h = 3$.
Using the step-deviation method:
$\bar{x} = a + \left( \frac{\sum f_i u_i}{\sum f_i} \right) \times h$
$\bar{x} = 57 + \left( \frac{25}{400} \right) \times 3 = 57 + \frac{75}{400} = 57 + 0.1875 = 57.1875 \approx 57.19$.
We chose the step-deviation method because the values of $f_i$ and $d_i$ are large and there is a common factor $h=3$.
| Class interval | $f_i$ | $x_i$ | $d_i = x_i - 57$ | $u_i = d_i / 3$ | $f_i u_i$ |
| $49.5-52.5$ | $15$ | $51$ | $-6$ | $-2$ | $-30$ |
| $52.5-55.5$ | $110$ | $54$ | $-3$ | $-1$ | $-110$ |
| $55.5-58.5$ | $135$ | $57$ | $0$ | $0$ | $0$ |
| $58.5-61.5$ | $115$ | $60$ | $3$ | $1$ | $115$ |
| $61.5-64.5$ | $25$ | $63$ | $6$ | $2$ | $50$ |
| Total | $400$ | $25$ |
Here,$\sum f_i = 400$,$\sum f_i u_i = 25$,assumed mean $a = 57$,and class size $h = 3$.
Using the step-deviation method:
$\bar{x} = a + \left( \frac{\sum f_i u_i}{\sum f_i} \right) \times h$
$\bar{x} = 57 + \left( \frac{25}{400} \right) \times 3 = 57 + \frac{75}{400} = 57 + 0.1875 = 57.1875 \approx 57.19$.
We chose the step-deviation method because the values of $f_i$ and $d_i$ are large and there is a common factor $h=3$.
0 likes
View Solution9
MediumMCQ
The table below shows the daily expenditure on food of $25$ households in a locality.
Find the mean daily expenditure on food by a suitable method.
| Daily expenditure (in $Rs.$) | $100-150$ | $150-200$ | $200-250$ | $250-300$ | $300-350$ |
| Number of households | $4$ | $5$ | $12$ | $2$ | $2$ |
Find the mean daily expenditure on food by a suitable method.
A
$211$
B
$200$
C
$209$
D
$205$
Solution
(A) To find the class mark $(x_{i})$ for each interval,the following relation is used:
$x_{i} = \frac{\text{Upper class limit} + \text{Lower class limit}}{2}$
Class size $(h) = 50$.
Taking $225$ as the assumed mean $(a)$,we calculate $d_i$,$u_i$,and $f_iu_i$ as follows:
Using the step-deviation method:
Mean $(\bar{x}) = a + \left(\frac{\Sigma f_{i}u_{i}}{\Sigma f_{i}}\right) \times h$
$\bar{x} = 225 + \left(\frac{-7}{25}\right) \times 50$
$\bar{x} = 225 + (-7 \times 2)$
$\bar{x} = 225 - 14 = 211$
Therefore,the mean daily expenditure on food is $Rs. 211$.
$x_{i} = \frac{\text{Upper class limit} + \text{Lower class limit}}{2}$
Class size $(h) = 50$.
Taking $225$ as the assumed mean $(a)$,we calculate $d_i$,$u_i$,and $f_iu_i$ as follows:
| Daily expenditure (in $Rs.$) | $f_{i}$ | $x_{i}$ | $d_{i} = x_{i} - 225$ | $u_{i} = \frac{d_{i}}{50}$ | $f_{i}u_{i}$ |
| $100-150$ | $4$ | $125$ | $-100$ | $-2$ | $-8$ |
| $150-200$ | $5$ | $175$ | $-50$ | $-1$ | $-5$ |
| $200-250$ | $12$ | $225$ | $0$ | $0$ | $0$ |
| $250-300$ | $2$ | $275$ | $50$ | $1$ | $2$ |
| $300-350$ | $2$ | $325$ | $100$ | $2$ | $4$ |
| Total | $\Sigma f_{i} = 25$ | $\Sigma f_{i}u_{i} = -7$ |
Using the step-deviation method:
Mean $(\bar{x}) = a + \left(\frac{\Sigma f_{i}u_{i}}{\Sigma f_{i}}\right) \times h$
$\bar{x} = 225 + \left(\frac{-7}{25}\right) \times 50$
$\bar{x} = 225 + (-7 \times 2)$
$\bar{x} = 225 - 14 = 211$
Therefore,the mean daily expenditure on food is $Rs. 211$.
0 likes
View Solution10
EasyMCQ
To find out the concentration of $SO_{2}$ in the air (in $parts\, per\, million$,i.e.,$ppm$),the data was collected for $30$ localities in a certain city and is presented below:
Find the mean concentration of $SO_{2}$ in the air.
| Concentration of $SO_{2}$ (in $ppm$) | Frequency |
|---|---|
| $0.00-0.04$ | $4$ |
| $0.04-0.08$ | $9$ |
| $0.08-0.12$ | $9$ |
| $0.12-0.16$ | $2$ |
| $0.16-0.20$ | $4$ |
| $0.20-0.24$ | $2$ |
Find the mean concentration of $SO_{2}$ in the air.
A
$0.089$
B
$0.099$
C
$0.067$
D
$0.056$
Solution
(B) To find the class marks $(x_{i})$ for each interval,we use the formula:
$x_{i} = \frac{\text{Upper class limit} + \text{Lower class limit}}{2}$
The class size $(h)$ is $0.04 - 0.00 = 0.04$.
Let the assumed mean $(a)$ be $0.14$.
We calculate $d_{i} = x_{i} - a$ and $u_{i} = \frac{d_{i}}{h}$.
Using the step-deviation method:
Mean $\bar{x} = a + \left( \frac{\Sigma f_{i}u_{i}}{\Sigma f_{i}} \right) \times h$
$\bar{x} = 0.14 + \left( \frac{-31}{30} \right) \times 0.04$
$\bar{x} = 0.14 - \frac{1.24}{30}$
$\bar{x} = 0.14 - 0.04133...$
$\bar{x} \approx 0.09867 \approx 0.099\, ppm$.
Thus,the mean concentration of $SO_{2}$ in the air is $0.099\, ppm$.
$x_{i} = \frac{\text{Upper class limit} + \text{Lower class limit}}{2}$
The class size $(h)$ is $0.04 - 0.00 = 0.04$.
Let the assumed mean $(a)$ be $0.14$.
We calculate $d_{i} = x_{i} - a$ and $u_{i} = \frac{d_{i}}{h}$.
| Concentration of $SO_{2}$ $(ppm)$ | Frequency $(f_{i})$ | Class mark $(x_{i})$ | $d_{i} = x_{i} - 0.14$ | $u_{i} = \frac{d_{i}}{0.04}$ | $f_{i}u_{i}$ |
|---|---|---|---|---|---|
| $0.00-0.04$ | $4$ | $0.02$ | $-0.12$ | $-3$ | $-12$ |
| $0.04-0.08$ | $9$ | $0.06$ | $-0.08$ | $-2$ | $-18$ |
| $0.08-0.12$ | $9$ | $0.10$ | $-0.04$ | $-1$ | $-9$ |
| $0.12-0.16$ | $2$ | $0.14$ | $0$ | $0$ | $0$ |
| $0.16-0.20$ | $4$ | $0.18$ | $0.04$ | $1$ | $4$ |
| $0.20-0.24$ | $2$ | $0.22$ | $0.08$ | $2$ | $4$ |
| Total | $\Sigma f_{i} = 30$ | $\Sigma f_{i}u_{i} = -31$ |
Using the step-deviation method:
Mean $\bar{x} = a + \left( \frac{\Sigma f_{i}u_{i}}{\Sigma f_{i}} \right) \times h$
$\bar{x} = 0.14 + \left( \frac{-31}{30} \right) \times 0.04$
$\bar{x} = 0.14 - \frac{1.24}{30}$
$\bar{x} = 0.14 - 0.04133...$
$\bar{x} \approx 0.09867 \approx 0.099\, ppm$.
Thus,the mean concentration of $SO_{2}$ in the air is $0.099\, ppm$.
1 likes
View Solution11
MediumMCQ
$A$ class teacher has the following absentee record of $40$ students of a class for the whole term. Find the mean number of $days$ a student was absent.
$\begin{array}{|l|c|c|c|c|c|c|c|} \hline \text{Number of days} & 0-6 & 6-10 & 10-14 & 14-20 & 20-28 & 28-38 & 38-40 \\ \hline \text{Number of students} & 11 & 10 & 7 & 4 & 4 & 3 & 1 \\ \hline \end{array}$
$\begin{array}{|l|c|c|c|c|c|c|c|} \hline \text{Number of days} & 0-6 & 6-10 & 10-14 & 14-20 & 20-28 & 28-38 & 38-40 \\ \hline \text{Number of students} & 11 & 10 & 7 & 4 & 4 & 3 & 1 \\ \hline \end{array}$
A
$16$
B
$15.5$
C
$12.48$
D
$13.41$
Solution
(C) To find the mean number of days,we first calculate the class mark $(x_i)$ for each interval using the formula: $x_i = \frac{\text{Upper class limit} + \text{Lower class limit}}{2}$.
Using the assumed mean method with $a = 17$,we calculate $d_i = x_i - a$ and $f_i d_i$:
The mean $\bar{x}$ is given by $\bar{x} = a + \frac{\sum f_i d_i}{\sum f_i}$.
Substituting the values: $\bar{x} = 17 + \frac{-181}{40} = 17 - 4.525 = 12.475$.
Rounding to two decimal places,the mean number of days is $12.48$ days.
Using the assumed mean method with $a = 17$,we calculate $d_i = x_i - a$ and $f_i d_i$:
| Number of days | Number of students $(f_i)$ | $x_i$ | $d_i = x_i - 17$ | $f_i d_i$ |
| $0-6$ | $11$ | $3$ | $-14$ | $-154$ |
| $6-10$ | $10$ | $8$ | $-9$ | $-90$ |
| $10-14$ | $7$ | $12$ | $-5$ | $-35$ |
| $14-20$ | $4$ | $17$ | $0$ | $0$ |
| $20-28$ | $4$ | $24$ | $7$ | $28$ |
| $28-38$ | $3$ | $33$ | $16$ | $48$ |
| $38-40$ | $1$ | $39$ | $22$ | $22$ |
| Total | $\sum f_i = 40$ | $\sum f_i d_i = -181$ |
The mean $\bar{x}$ is given by $\bar{x} = a + \frac{\sum f_i d_i}{\sum f_i}$.
Substituting the values: $\bar{x} = 17 + \frac{-181}{40} = 17 - 4.525 = 12.475$.
Rounding to two decimal places,the mean number of days is $12.48$ days.
0 likes
View Solution12
DifficultMCQ
The following table gives the literacy rate (in percentage) of $35$ cities. Find the mean literacy rate.
| Literacy rate (in $\%$) | $45-55$ | $55-65$ | $65-75$ | $75-85$ | $85-95$ |
| Number of cities | $3$ | $10$ | $11$ | $8$ | $3$ |
A
$74.56$
B
$61.22$
C
$64$
D
$69.43$
Solution
(D) To find the class marks $(x_i)$,the following relation is used:
$x_i = \frac{\text{Upper class limit} + \text{Lower class limit}}{2}$
Class size $(h)$ for this data $= 10$.
Taking $70$ as the assumed mean $(a)$,$d_i$,$u_i$,and $f_i u_i$ are calculated as follows:
From the table,we obtain:
$\sum f_i = 35$
$\sum f_i u_i = -2$
Mean,$\bar{x} = a + \left(\frac{\sum f_i u_i}{\sum f_i}\right) \times h$
$= 70 + \left(\frac{-2}{35}\right) \times 10$
$= 70 - \frac{20}{35}$
$= 70 - \frac{4}{7}$
$= 70 - 0.5714...$
$\approx 69.43$
Therefore,the mean literacy rate is $69.43 \%$.
$x_i = \frac{\text{Upper class limit} + \text{Lower class limit}}{2}$
Class size $(h)$ for this data $= 10$.
Taking $70$ as the assumed mean $(a)$,$d_i$,$u_i$,and $f_i u_i$ are calculated as follows:
| Literacy rate (in $\%$) | Number of cities $(f_i)$ | $x_i$ | $d_i = x_i - 70$ | $u_i = \frac{d_i}{10}$ | $f_i u_i$ |
| $45-55$ | $3$ | $50$ | $-20$ | $-2$ | $-6$ |
| $55-65$ | $10$ | $60$ | $-10$ | $-1$ | $-10$ |
| $65-75$ | $11$ | $70$ | $0$ | $0$ | $0$ |
| $75-85$ | $8$ | $80$ | $10$ | $1$ | $8$ |
| $85-95$ | $3$ | $90$ | $20$ | $2$ | $6$ |
| Total | $\sum f_i = 35$ | $\sum f_i u_i = -2$ |
From the table,we obtain:
$\sum f_i = 35$
$\sum f_i u_i = -2$
Mean,$\bar{x} = a + \left(\frac{\sum f_i u_i}{\sum f_i}\right) \times h$
$= 70 + \left(\frac{-2}{35}\right) \times 10$
$= 70 - \frac{20}{35}$
$= 70 - \frac{4}{7}$
$= 70 - 0.5714...$
$\approx 69.43$
Therefore,the mean literacy rate is $69.43 \%$.
2 likes
View Solution13
EasyMCQ
The wickets taken by a bowler in $10$ cricket matches are as follows:
$2, 6, 4, 5, 0, 2, 1, 3, 2, 3$
Find the mode of the data.
$2, 6, 4, 5, 0, 2, 1, 3, 2, 3$
Find the mode of the data.
A
$2$
B
$3$
C
$5$
D
$7$
Solution
(A) To find the mode,we first organize the data into a frequency distribution table:
The mode is the observation that occurs most frequently. From the table,the number of wickets $2$ appears $3$ times,which is the highest frequency.
Therefore,the mode of the given data is $2$.
| Number of wickets | $0$ | $1$ | $2$ | $3$ | $4$ | $5$ | $6$ |
| Number of matches | $1$ | $1$ | $3$ | $2$ | $1$ | $1$ | $1$ |
The mode is the observation that occurs most frequently. From the table,the number of wickets $2$ appears $3$ times,which is the highest frequency.
Therefore,the mode of the given data is $2$.
0 likes
View Solution14
EasyMCQ
$A$ survey conducted on $20$ households in a locality by a group of students resulted in the following frequency table for the number of family members in a household:
Find the mode of this data.
| Family size | $1-3$ | $3-5$ | $5-7$ | $7-9$ | $9-11$ |
| Number of families | $7$ | $8$ | $2$ | $2$ | $1$ |
Find the mode of this data.
A
$3.400$
B
$3.286$
C
$5.680$
D
$2.714$
Solution
(B) Here,the maximum class frequency is $8$,and the class corresponding to this frequency is $3-5$.
So,the modal class is $3-5$.
Now,
Modal class $= 3-5$,lower limit $(l)$ of modal class $= 3$,class size $(h) = 2$.
Frequency $(f_1)$ of the modal class $= 8$.
Frequency $(f_0)$ of the class preceding the modal class $= 7$.
Frequency $(f_2)$ of the class succeeding the modal class $= 2$.
Now,let us substitute these values in the formula:
Mode $= l + \left( \frac{f_1 - f_0}{2f_1 - f_0 - f_2} \right) \times h$
Mode $= 3 + \left( \frac{8 - 7}{2 \times 8 - 7 - 2} \right) \times 2 = 3 + \frac{2}{7} = 3 + 0.286 = 3.286$.
Therefore,the mode of the data above is $3.286$.
1 likes
View Solution15
Medium
The marks distribution of $30$ students in a mathematics examination is given in the table. Find the mode of this data. Also,compare and interpret the mode and the mean.
| Class interval | $10-25$ | $25-40$ | $40-55$ | $55-70$ | $70-85$ | $85-100$ |
| Number of students | $2$ | $3$ | $7$ | $6$ | $6$ | $6$ |
Solution
(52) To find the mean,we calculate the class marks $(x_i)$ and $f_i x_i$:
Mean $\bar{x} = \frac{\Sigma f_i x_i}{\Sigma f_i} = \frac{1860}{30} = 62$.
For the mode,the maximum frequency is $7$,which corresponds to the modal class $40-55$.
Here,$l = 40$,$h = 15$,$f_1 = 7$,$f_0 = 3$,$f_2 = 6$.
Mode $= l + \left( \frac{f_1 - f_0}{2f_1 - f_0 - f_2} \right) \times h = 40 + \left( \frac{7 - 3}{14 - 3 - 6} \right) \times 15 = 40 + \left( \frac{4}{5} \right) \times 15 = 40 + 12 = 52$.
Interpretation: The maximum number of students obtained $52$ marks (mode),while on average,a student obtained $62$ marks (mean).
| Class interval | Number of students $(f_i)$ | Class mark $(x_i)$ | $f_i x_i$ |
| $10-25$ | $2$ | $17.5$ | $35.0$ |
| $25-40$ | $3$ | $32.5$ | $97.5$ |
| $40-55$ | $7$ | $47.5$ | $332.5$ |
| $55-70$ | $6$ | $62.5$ | $375.0$ |
| $70-85$ | $6$ | $77.5$ | $465.0$ |
| $85-100$ | $6$ | $92.5$ | $555.0$ |
| Total | $\Sigma f_i = 30$ | $\Sigma f_i x_i = 1860.0$ |
Mean $\bar{x} = \frac{\Sigma f_i x_i}{\Sigma f_i} = \frac{1860}{30} = 62$.
For the mode,the maximum frequency is $7$,which corresponds to the modal class $40-55$.
Here,$l = 40$,$h = 15$,$f_1 = 7$,$f_0 = 3$,$f_2 = 6$.
Mode $= l + \left( \frac{f_1 - f_0}{2f_1 - f_0 - f_2} \right) \times h = 40 + \left( \frac{7 - 3}{14 - 3 - 6} \right) \times 15 = 40 + \left( \frac{4}{5} \right) \times 15 = 40 + 12 = 52$.
Interpretation: The maximum number of students obtained $52$ marks (mode),while on average,a student obtained $62$ marks (mean).
0 likes
View Solution16
Difficult
The following table shows the ages of the patients admitted in a hospital during a year:
Find the mode and the mean of the data given above. Compare and interpret the two measures of central tendency.
| Age (in years) | $5$-$15$ | $15$-$25$ | $25$-$35$ | $35$-$45$ | $45$-$55$ | $55$-$65$ |
| Number of patients | $6$ | $11$ | $21$ | $23$ | $14$ | $5$ |
Find the mode and the mean of the data given above. Compare and interpret the two measures of central tendency.
Solution
(N/A) To find the class marks $(x_{i})$,the following relation is used:
$x_{i} = \frac{\text{Upper class limit} + \text{Lower class limit}}{2}$
Taking $30$ as the assumed mean $(a)$,$d_i$ and $f_id_i$ are calculated as follows:
From the table,we obtain $\Sigma f_{i} = 80$ and $\Sigma f_{i} d_{i} = 430$.
Mean,$\bar{x} = a + \frac{\Sigma f_{i} d_{i}}{\Sigma f_{i}} = 30 + \frac{430}{80} = 30 + 5.375 = 35.375 \simeq 35.38$.
The mean age of the patients is $35.38 \text{ years}$. This represents that,on average,the age of a patient admitted to the hospital was $35.38 \text{ years}$.
It can be observed that the maximum class frequency is $23$,belonging to the class interval $35-45$.
Modal class $= 35-45$,Lower limit $(l) = 35$,Class size $(h) = 10$,Frequency $(f_1) = 23$,Frequency $(f_0) = 21$,Frequency $(f_2) = 14$.
Mode $= l + \left( \frac{f_1 - f_0}{2f_1 - f_0 - f_2} \right) \times h = 35 + \left( \frac{23 - 21}{2(23) - 21 - 14} \right) \times 10 = 35 + \left( \frac{2}{46 - 35} \right) \times 10 = 35 + \frac{20}{11} = 35 + 1.81 = 36.81$.
The mode is $36.81$. This represents that the age of the maximum number of patients admitted to the hospital was $36.81 \text{ years}$.
$x_{i} = \frac{\text{Upper class limit} + \text{Lower class limit}}{2}$
Taking $30$ as the assumed mean $(a)$,$d_i$ and $f_id_i$ are calculated as follows:
| Age (in years) | Number of patients $(f_i)$ | Class mark $(x_i)$ | $d_i = x_i - 30$ | $f_i d_i$ |
| $5$-$15$ | $6$ | $10$ | -$20$ | -$120$ |
| $15$-$25$ | $11$ | $20$ | -$10$ | -$110$ |
| $25$-$35$ | $21$ | $30$ | $0$ | $0$ |
| $35$-$45$ | $23$ | $40$ | $10$ | $230$ |
| $45$-$55$ | $14$ | $50$ | $20$ | $280$ |
| $55$-$65$ | $5$ | $60$ | $30$ | $150$ |
| Total | $80$ | - | - | $430$ |
From the table,we obtain $\Sigma f_{i} = 80$ and $\Sigma f_{i} d_{i} = 430$.
Mean,$\bar{x} = a + \frac{\Sigma f_{i} d_{i}}{\Sigma f_{i}} = 30 + \frac{430}{80} = 30 + 5.375 = 35.375 \simeq 35.38$.
The mean age of the patients is $35.38 \text{ years}$. This represents that,on average,the age of a patient admitted to the hospital was $35.38 \text{ years}$.
It can be observed that the maximum class frequency is $23$,belonging to the class interval $35-45$.
Modal class $= 35-45$,Lower limit $(l) = 35$,Class size $(h) = 10$,Frequency $(f_1) = 23$,Frequency $(f_0) = 21$,Frequency $(f_2) = 14$.
Mode $= l + \left( \frac{f_1 - f_0}{2f_1 - f_0 - f_2} \right) \times h = 35 + \left( \frac{23 - 21}{2(23) - 21 - 14} \right) \times 10 = 35 + \left( \frac{2}{46 - 35} \right) \times 10 = 35 + \frac{20}{11} = 35 + 1.81 = 36.81$.
The mode is $36.81$. This represents that the age of the maximum number of patients admitted to the hospital was $36.81 \text{ years}$.
0 likes
View Solution17
DifficultMCQ
The following data provides information on the observed lifetimes (in $hours$) of $225$ electrical components:
Determine the modal lifetimes of the components.
| Lifetimes (in hours) | $0-20$ | $20-40$ | $40-60$ | $60-80$ | $80-100$ | $100-120$ |
| Frequency | $10$ | $35$ | $52$ | $61$ | $38$ | $29$ |
Determine the modal lifetimes of the components.
A
$65.625$
B
$60.100$
C
$64.475$
D
$70.500$
Solution
(A) From the data given above,it can be observed that the maximum class frequency is $61$,which belongs to the class interval $60-80$.
Therefore,the modal class is $60-80$.
Lower class limit $(l)$ of the modal class $= 60$.
Frequency $(f_1)$ of the modal class $= 61$.
Frequency $(f_0)$ of the class preceding the modal class $= 52$.
Frequency $(f_2)$ of the class succeeding the modal class $= 38$.
Class size $(h) = 20$.
Using the formula for mode:
$\text{Mode} = l + \left( \frac{f_1 - f_0}{2f_1 - f_0 - f_2} \right) \times h$
$= 60 + \left( \frac{61 - 52}{2(61) - 52 - 38} \right) \times 20$
$= 60 + \left( \frac{9}{122 - 90} \right) \times 20$
$= 60 + \left( \frac{9}{32} \right) \times 20$
$= 60 + \frac{180}{32} = 60 + 5.625 = 65.625$.
Therefore,the modal lifetime of the electrical components is $65.625 \text{ hours}$.
2 likes
View Solution18
Medium
The following data gives the distribution of total monthly household expenditure of $200$ families of a village. Find the modal monthly expenditure of the families. Also,find the mean monthly expenditure:
$\begin{array}{|c|c|} \hline \text{Expenditure (in Rs)} & \text{Number of families} \\ \hline 1000-1500 & 24 \\ 1500-2000 & 40 \\ 2000-2500 & 33 \\ 2500-3000 & 28 \\ 3000-3500 & 30 \\ 3500-4000 & 22 \\ 4000-4500 & 16 \\ 4500-5000 & 7 \\ \hline \end{array}$
$\begin{array}{|c|c|} \hline \text{Expenditure (in Rs)} & \text{Number of families} \\ \hline 1000-1500 & 24 \\ 1500-2000 & 40 \\ 2000-2500 & 33 \\ 2500-3000 & 28 \\ 3000-3500 & 30 \\ 3500-4000 & 22 \\ 4000-4500 & 16 \\ 4500-5000 & 7 \\ \hline \end{array}$
Solution
(N/A) It can be observed from the given data that the maximum class frequency is $40$,belonging to $1500-2000$ interval.
Therefore,modal class $= 1500-2000$.
Lower limit $(l)$ of modal class $= 1500$.
Frequency $(f_1)$ of modal class $= 40$.
Frequency $(f_0)$ of class preceding modal class $= 24$.
Frequency $(f_2)$ of class succeeding modal class $= 33$.
Class size $(h) = 500$.
Mode $= l + \left( \frac{f_1 - f_0}{2f_1 - f_0 - f_2} \right) \times h$
$= 1500 + \left( \frac{40 - 24}{2(40) - 24 - 33} \right) \times 500$
$= 1500 + \left( \frac{16}{80 - 57} \right) \times 500 = 1500 + \frac{8000}{23} \approx 1500 + 347.83 = 1847.83$.
Thus,the modal monthly expenditure is Rs. $1847.83$.
To find the mean,we use the step-deviation method:
Mean $(\bar{x}) = a + h \times \left( \frac{\sum f_i u_i}{\sum f_i} \right)$
Using $a = 2750$ and $h = 500$,we calculate $\sum f_i u_i = -35$ and $\sum f_i = 200$.
Mean $= 2750 + 500 \times \left( \frac{-35}{200} \right) = 2750 - 87.5 = 2662.5$.
Thus,the mean monthly expenditure is Rs. $2662.5$.
1 likes
View Solution19
Medium
The following distribution gives the state-wise teacher-student ratio in higher secondary schools of India. Find the mode and mean of this data. Interpret the two measures.
| Number of students per teacher | Number of states/$U$.$T$. |
| $15-20$ | $3$ |
| $20-25$ | $8$ |
| $25-30$ | $9$ |
| $30-35$ | $10$ |
| $35-40$ | $3$ |
| $40-45$ | $0$ |
| $45-50$ | $0$ |
| $50-55$ | $2$ |
Solution
(N/A) It can be observed from the given data that the maximum class frequency is $10$ belonging to class interval $30-35$.
Therefore,modal class $= 30-35$.
Class size $(h) = 5$.
Lower limit $(l)$ of modal class $= 30$.
Frequency $(f_1)$ of modal class $= 10$.
Frequency $(f_0)$ of class preceding modal class $= 9$.
Frequency $(f_2)$ of class succeeding modal class $= 3$.
Mode $= l + \left(\frac{f_1 - f_0}{2f_1 - f_0 - f_2}\right) \times h = 30 + \left(\frac{10 - 9}{2(10) - 9 - 3}\right) \times 5 = 30 + \left(\frac{1}{20 - 12}\right) \times 5 = 30 + \frac{5}{8} = 30.625$.
Mode $\approx 30.6$.
This represents that most of the states/$U$.$T$. have a teacher-student ratio of approximately $30.6$.
To find the mean,we use the step-deviation method.
Mean $\bar{x} = a + \left(\frac{\sum f_i u_i}{\sum f_i}\right) \times h$.
Using assumed mean $a = 32.5$ and $h = 5$,we calculate $\sum f_i u_i = -23$ and $\sum f_i = 35$.
Mean $\bar{x} = 32.5 + \left(\frac{-23}{35}\right) \times 5 = 32.5 - \frac{23}{7} = 32.5 - 3.2857 \approx 29.21$.
Therefore,the mean of the data is approximately $29.2$.
2 likes
View Solution20
MediumMCQ
The given distribution shows the number of runs scored by some top batsmen of the world in one-day international cricket matches.
Find the mode of the data.
| Runs scored | Number of batsmen |
| $3000-4000$ | $4$ |
| $4000-5000$ | $18$ |
| $5000-6000$ | $9$ |
| $6000-7000$ | $7$ |
| $7000-8000$ | $6$ |
| $8000-9000$ | $3$ |
| $9000-10000$ | $1$ |
| $10000-11000$ | $1$ |
Find the mode of the data.
A
$3608.7$
B
$4985.50$
C
$4500$
D
$4608.7$
Solution
(D) From the given data,the maximum class frequency is $18$,which corresponds to the class interval $4000-5000$.
Therefore,the modal class is $4000-5000$.
Lower limit $(l)$ of the modal class $= 4000$.
Frequency $(f_1)$ of the modal class $= 18$.
Frequency $(f_0)$ of the class preceding the modal class $= 4$.
Frequency $(f_2)$ of the class succeeding the modal class $= 9$.
Class size $(h) = 1000$.
The formula for mode is:
$\text{Mode} = l + \left( \frac{f_1 - f_0}{2f_1 - f_0 - f_2} \right) \times h$
Substituting the values:
$\text{Mode} = 4000 + \left( \frac{18 - 4}{2(18) - 4 - 9} \right) \times 1000$
$\text{Mode} = 4000 + \left( \frac{14}{36 - 13} \right) \times 1000$
$\text{Mode} = 4000 + \left( \frac{14}{23} \right) \times 1000$
$\text{Mode} = 4000 + \frac{14000}{23}$
$\text{Mode} = 4000 + 608.695...$
$\text{Mode} \approx 4608.7$
Therefore,the mode of the given data is $4608.7$ runs.
0 likes
View Solution21
MediumMCQ
$A$ student noted the number of cars passing through a spot on a road for $100$ periods each of $3\, \text{minutes}$ and summarized it in the table given below. Find the mode of the data:
| Number of cars | $0-10$ | $10-20$ | $20-30$ | $30-40$ | $40-50$ | $50-60$ | $60-70$ | $70-80$ |
| Frequency | $7$ | $14$ | $13$ | $12$ | $20$ | $11$ | $15$ | $8$ |
A
$44.7$
B
$40$
C
$35.3$
D
$43.50$
Solution
(A) From the given data, it can be observed that the maximum class frequency is $20,$ which belongs to the $40-50$ class interval.
Therefore, the modal class $= 40-50$.
Lower limit $(l)$ of the modal class $= 40$.
Frequency $(f_1)$ of the modal class $= 20$.
Frequency $(f_0)$ of the class preceding the modal class $= 12$.
Frequency $(f_2)$ of the class succeeding the modal class $= 11$.
Class size $(h) = 10$.
Using the mode formula: $\text{Mode} = l + \left( \frac{f_1 - f_0}{2f_1 - f_0 - f_2} \right) \times h$.
$\text{Mode} = 40 + \left( \frac{20 - 12}{2(20) - 12 - 11} \right) \times 10$.
$\text{Mode} = 40 + \left( \frac{8}{40 - 23} \right) \times 10$.
$\text{Mode} = 40 + \left( \frac{8}{17} \right) \times 10$.
$\text{Mode} = 40 + \frac{80}{17}$.
$\text{Mode} = 40 + 4.705 \approx 44.7$.
Therefore, the mode of this data is $44.7$ cars.
0 likes
View Solution22
EasyMCQ
$A$ survey regarding the heights (in $cm$) of $51$ girls of Class $X$ of a school was conducted and the following data was obtained:
Find the median height.
| Height (in $cm$) | Number of girls |
| Less than $140$ | $4$ |
| Less than $145$ | $11$ |
| Less than $150$ | $29$ |
| Less than $155$ | $40$ |
| Less than $160$ | $46$ |
| Less than $165$ | $51$ |
Find the median height.
A
$145$
B
$149.03$
C
$141$
D
$155.5$
Solution
(B) To calculate the median height,we first convert the cumulative frequency distribution into a standard frequency distribution table.
Here,$n = 51$. So,$\frac{n}{2} = \frac{51}{2} = 25.5$.
The cumulative frequency just greater than $25.5$ is $29$,which corresponds to the class interval $145-150$. Thus,the median class is $145-150$.
Here,$l = 145$,$cf = 11$,$f = 18$,and $h = 5$.
Using the median formula: $\text{Median} = l + \left( \frac{\frac{n}{2} - cf}{f} \right) \times h$
$\text{Median} = 145 + \left( \frac{25.5 - 11}{18} \right) \times 5$
$\text{Median} = 145 + \left( \frac{14.5}{18} \right) \times 5 = 145 + \frac{72.5}{18} = 145 + 4.027... \approx 149.03 \ cm$.
| Class intervals | Frequency $(f)$ | Cumulative frequency $(cf)$ |
| Below $140$ | $4$ | $4$ |
| $140-145$ | $7$ | $11$ |
| $145-150$ | $18$ | $29$ |
| $150-155$ | $11$ | $40$ |
| $155-160$ | $6$ | $46$ |
| $160-165$ | $5$ | $51$ |
Here,$n = 51$. So,$\frac{n}{2} = \frac{51}{2} = 25.5$.
The cumulative frequency just greater than $25.5$ is $29$,which corresponds to the class interval $145-150$. Thus,the median class is $145-150$.
Here,$l = 145$,$cf = 11$,$f = 18$,and $h = 5$.
Using the median formula: $\text{Median} = l + \left( \frac{\frac{n}{2} - cf}{f} \right) \times h$
$\text{Median} = 145 + \left( \frac{25.5 - 11}{18} \right) \times 5$
$\text{Median} = 145 + \left( \frac{14.5}{18} \right) \times 5 = 145 + \frac{72.5}{18} = 145 + 4.027... \approx 149.03 \ cm$.
3 likes
View Solution23
Medium
The median of the following data is $525$. Find the values of $x$ and $y$,if the total frequency is $100$.
| Class interval | Frequency |
| $0-100$ | $2$ |
| $100-200$ | $5$ |
| $200-300$ | $x$ |
| $300-400$ | $12$ |
| $400-500$ | $17$ |
| $500-600$ | $20$ |
| $600-700$ | $y$ |
| $700-800$ | $9$ |
| $800-900$ | $7$ |
| $900-1000$ | $4$ |
Solution
(X=9, Y=15) First,we construct the cumulative frequency table:
Given that the total frequency $n = 100$,we have:
$76 + x + y = 100 \implies x + y = 24$ ........... $(1)$
The median is $525$,which lies in the class $500-600$. Thus,$l = 500$,$f = 20$,$cf = 36 + x$,and $h = 100$.
Using the median formula: $\text{Median} = l + \left( \frac{\frac{n}{2} - cf}{f} \right) \times h$
$525 = 500 + \left( \frac{50 - (36 + x)}{20} \right) \times 100$
$25 = (14 - x) \times 5$
$5 = 14 - x$
$x = 9$
Substituting $x = 9$ into equation $(1)$:
$9 + y = 24 \implies y = 15$.
Thus,$x = 9$ and $y = 15$.
| Class intervals | Frequency | Cumulative frequency |
| $0-100$ | $2$ | $2$ |
| $100-200$ | $5$ | $7$ |
| $200-300$ | $x$ | $7+x$ |
| $300-400$ | $12$ | $19+x$ |
| $400-500$ | $17$ | $36+x$ |
| $500-600$ | $20$ | $56+x$ |
| $600-700$ | $y$ | $56+x+y$ |
| $700-800$ | $9$ | $65+x+y$ |
| $800-900$ | $7$ | $72+x+y$ |
| $900-1000$ | $4$ | $76+x+y$ |
Given that the total frequency $n = 100$,we have:
$76 + x + y = 100 \implies x + y = 24$ ........... $(1)$
The median is $525$,which lies in the class $500-600$. Thus,$l = 500$,$f = 20$,$cf = 36 + x$,and $h = 100$.
Using the median formula: $\text{Median} = l + \left( \frac{\frac{n}{2} - cf}{f} \right) \times h$
$525 = 500 + \left( \frac{50 - (36 + x)}{20} \right) \times 100$
$25 = (14 - x) \times 5$
$5 = 14 - x$
$x = 9$
Substituting $x = 9$ into equation $(1)$:
$9 + y = 24 \implies y = 15$.
Thus,$x = 9$ and $y = 15$.
2 likes
View Solution24
Difficult
The following frequency distribution gives the monthly consumption of electricity of $68$ consumers of a locality. Find the median,mean,and mode of the data and compare them.
| Monthly consumption (in units) | Number of consumers |
| $65-85$ | $4$ |
| $85-105$ | $5$ |
| $105-125$ | $13$ |
| $125-145$ | $20$ |
| $145-165$ | $14$ |
| $165-185$ | $8$ |
| $185-205$ | $4$ |
Solution
(N/A) $1$. Mean: Using the step deviation method,$\bar{x} = a + h \left( \frac{\sum f_i u_i}{\sum f_i} \right)$. With $a = 135, h = 20, \sum f_i u_i = 7, \sum f_i = 68$,we get $\bar{x} = 135 + 20 \left( \frac{7}{68} \right) = 135 + 2.06 = 137.06$.
$2$. Mode: Modal class is $125-145$ $(f_1=20, f_0=13, f_2=14)$. Mode $= l + \left( \frac{f_1 - f_0}{2f_1 - f_0 - f_2} \right) \times h = 125 + \left( \frac{20 - 13}{40 - 13 - 14} \right) \times 20 = 125 + \left( \frac{7}{13} \right) \times 20 = 125 + 10.77 = 135.77$.
$3$. Median: $n=68, n/2=34$. Cumulative frequency table shows median class is $125-145$. Median $= l + \left( \frac{n/2 - cf}{f} \right) \times h = 125 + \left( \frac{34 - 22}{20} \right) \times 20 = 125 + 12 = 137$. Comparing them,Mean $\approx$ Median $\approx$ Mode.
0 likes
View Solution25
Difficult
If the median of the distribution given below is $28.5,$ find the values of $x$ and $y$.
| Class interval | Frequency |
| $0-10$ | $5$ |
| $10-20$ | $x$ |
| $20-30$ | $20$ |
| $30-40$ | $15$ |
| $40-50$ | $y$ |
| $50-60$ | $5$ |
| Total | $60$ |
Solution
(A) The cumulative frequency for the given data is calculated as follows:
From the table,the total frequency $n = 60$.
Thus,$45+x+y = 60 \implies x+y = 15 \dots (1)$.
The median is $28.5$,which lies in the class interval $20-30$.
Therefore,the median class is $20-30$.
Lower limit $(l) = 20$,frequency $(f) = 20$,cumulative frequency $(cf) = 5+x$,and class size $(h) = 10$.
Using the median formula: $\text{Median} = l + \left( \frac{\frac{n}{2} - cf}{f} \right) \times h$.
$28.5 = 20 + \left( \frac{30 - (5+x)}{20} \right) \times 10$.
$8.5 = \frac{25-x}{2}$.
$17 = 25 - x \implies x = 8$.
Substituting $x=8$ into equation $(1)$: $8+y = 15 \implies y = 7$.
Thus,$x = 8$ and $y = 7$.
| Class interval | Frequency | Cumulative frequency |
| $0-10$ | $5$ | $5$ |
| $10-20$ | $x$ | $5+x$ |
| $20-30$ | $20$ | $25+x$ |
| $30-40$ | $15$ | $40+x$ |
| $40-50$ | $y$ | $40+x+y$ |
| $50-60$ | $5$ | $45+x+y$ |
From the table,the total frequency $n = 60$.
Thus,$45+x+y = 60 \implies x+y = 15 \dots (1)$.
The median is $28.5$,which lies in the class interval $20-30$.
Therefore,the median class is $20-30$.
Lower limit $(l) = 20$,frequency $(f) = 20$,cumulative frequency $(cf) = 5+x$,and class size $(h) = 10$.
Using the median formula: $\text{Median} = l + \left( \frac{\frac{n}{2} - cf}{f} \right) \times h$.
$28.5 = 20 + \left( \frac{30 - (5+x)}{20} \right) \times 10$.
$8.5 = \frac{25-x}{2}$.
$17 = 25 - x \implies x = 8$.
Substituting $x=8$ into equation $(1)$: $8+y = 15 \implies y = 7$.
Thus,$x = 8$ and $y = 7$.
1 likes
View Solution26
DifficultMCQ
$A$ life insurance agent found the following data for the distribution of ages of $100$ policy holders. Calculate the median age,if policies are given only to persons having age $18$ years onwards but less than $60$ years.
| Age (in years) | Number of policy holders |
| Below $20$ | $2$ |
| Below $25$ | $6$ |
| Below $30$ | $24$ |
| Below $35$ | $45$ |
| Below $40$ | $78$ |
| Below $45$ | $89$ |
| Below $50$ | $92$ |
| Below $55$ | $98$ |
| Below $60$ | $100$ |
A
$35$
B
$35.76$
C
$25.56$
D
$35.33$
Solution
(B) The given data is in the form of 'less than' cumulative frequency distribution. We first convert it into class intervals with their respective frequencies.
Here,$n = 100$,so $\frac{n}{2} = 50$.
The cumulative frequency just greater than $50$ is $78$,which corresponds to the class interval $35-40$.
Thus,the median class is $35-40$.
Lower limit $(l)$ $= 35$,class size $(h)$ $= 5$,frequency of median class $(f)$ $= 33$,and cumulative frequency of the class preceding the median class $(cf)$ $= 45$.
Using the median formula: $\text{Median} = l + \left( \frac{\frac{n}{2} - cf}{f} \right) \times h$
$\text{Median} = 35 + \left( \frac{50 - 45}{33} \right) \times 5$
$\text{Median} = 35 + \left( \frac{5}{33} \right) \times 5 = 35 + \frac{25}{33} \approx 35 + 0.76 = 35.76$.
Therefore,the median age is $35.76$ years.
| Age (in years) | Frequency $(f_i)$ | Cumulative frequency $(cf)$ |
| $18-20$ | $2$ | $2$ |
| $20-25$ | $6-2=4$ | $6$ |
| $25-30$ | $24-6=18$ | $24$ |
| $30-35$ | $45-24=21$ | $45$ |
| $35-40$ | $78-45=33$ | $78$ |
| $40-45$ | $89-78=11$ | $89$ |
| $45-50$ | $92-89=3$ | $92$ |
| $50-55$ | $98-92=6$ | $98$ |
| $55-60$ | $100-98=2$ | $100$ |
Here,$n = 100$,so $\frac{n}{2} = 50$.
The cumulative frequency just greater than $50$ is $78$,which corresponds to the class interval $35-40$.
Thus,the median class is $35-40$.
Lower limit $(l)$ $= 35$,class size $(h)$ $= 5$,frequency of median class $(f)$ $= 33$,and cumulative frequency of the class preceding the median class $(cf)$ $= 45$.
Using the median formula: $\text{Median} = l + \left( \frac{\frac{n}{2} - cf}{f} \right) \times h$
$\text{Median} = 35 + \left( \frac{50 - 45}{33} \right) \times 5$
$\text{Median} = 35 + \left( \frac{5}{33} \right) \times 5 = 35 + \frac{25}{33} \approx 35 + 0.76 = 35.76$.
Therefore,the median age is $35.76$ years.
0 likes
View Solution27
MediumMCQ
The lengths of $40$ leaves of a plant are measured correct to the nearest millimetre,and the data obtained is represented in the following table:
Find the median length of the leaves.
| Length (in mm) | Number of leaves |
| $118-126$ | $3$ |
| $127-135$ | $5$ |
| $136-144$ | $9$ |
| $145-153$ | $12$ |
| $154-162$ | $5$ |
| $163-171$ | $4$ |
| $172-180$ | $2$ |
Find the median length of the leaves.
A
$140$
B
$144.5$
C
$146.75$
D
$153.5$
Solution
(C) The given data does not have continuous class intervals. The difference between the upper limit of one class and the lower limit of the next class is $127 - 126 = 1$. Therefore,we subtract $0.5$ from the lower limit and add $0.5$ to the upper limit of each class to make them continuous.
Continuous class intervals and cumulative frequencies are as follows:
Here,$n = 40$,so $\frac{n}{2} = 20$. The cumulative frequency just greater than $20$ is $29$,which corresponds to the class interval $144.5-153.5$.
Median class $= 144.5-153.5$,lower limit $(l)$ $= 144.5$,class size $(h)$ $= 9$,frequency $(f)$ $= 12$,and cumulative frequency of the preceding class $(cf)$ $= 17$.
Using the median formula: $\text{Median} = l + \left( \frac{\frac{n}{2} - cf}{f} \right) \times h$
$\text{Median} = 144.5 + \left( \frac{20 - 17}{12} \right) \times 9 = 144.5 + \left( \frac{3}{12} \right) \times 9 = 144.5 + 2.25 = 146.75$.
Thus,the median length of the leaves is $146.75 \text{ mm}$.
Continuous class intervals and cumulative frequencies are as follows:
| Length (in mm) | Frequency $(f_i)$ | Cumulative Frequency $(cf)$ |
| $117.5-126.5$ | $3$ | $3$ |
| $126.5-135.5$ | $5$ | $8$ |
| $135.5-144.5$ | $9$ | $17$ |
| $144.5-153.5$ | $12$ | $29$ |
| $153.5-162.5$ | $5$ | $34$ |
| $162.5-171.5$ | $4$ | $38$ |
| $171.5-180.5$ | $2$ | $40$ |
Here,$n = 40$,so $\frac{n}{2} = 20$. The cumulative frequency just greater than $20$ is $29$,which corresponds to the class interval $144.5-153.5$.
Median class $= 144.5-153.5$,lower limit $(l)$ $= 144.5$,class size $(h)$ $= 9$,frequency $(f)$ $= 12$,and cumulative frequency of the preceding class $(cf)$ $= 17$.
Using the median formula: $\text{Median} = l + \left( \frac{\frac{n}{2} - cf}{f} \right) \times h$
$\text{Median} = 144.5 + \left( \frac{20 - 17}{12} \right) \times 9 = 144.5 + \left( \frac{3}{12} \right) \times 9 = 144.5 + 2.25 = 146.75$.
Thus,the median length of the leaves is $146.75 \text{ mm}$.
1 likes
View Solution28
DifficultMCQ
The following table gives the distribution of the lifetime of $400$ neon lamps:
Find the median lifetime of a lamp.
| Life time (in hours) | Number of lamps |
| $1500-2000$ | $14$ |
| $2000-2500$ | $56$ |
| $2500-3000$ | $60$ |
| $3000-3500$ | $86$ |
| $3500-4000$ | $74$ |
| $4000-4500$ | $62$ |
| $4500-5000$ | $48$ |
Find the median lifetime of a lamp.
A
$3000$
B
$3500$
C
$3400$
D
$3406.98$
Solution
(D) The cumulative frequencies with their respective class intervals are as follows:
Here,$n = 400$,so $\frac{n}{2} = 200$.
The cumulative frequency just greater than $200$ is $216$,which corresponds to the class interval $3000-3500$.
Thus,the median class is $3000-3500$.
Lower limit $(l)$ of the median class = $3000$.
Frequency $(f)$ of the median class = $86$.
Cumulative frequency $(cf)$ of the class preceding the median class = $130$.
Class size $(h)$ = $500$.
Using the median formula: $\text{Median} = l + \left( \frac{\frac{n}{2} - cf}{f} \right) \times h$
$\text{Median} = 3000 + \left( \frac{200 - 130}{86} \right) \times 500$
$\text{Median} = 3000 + \left( \frac{70}{86} \right) \times 500$
$\text{Median} = 3000 + \frac{35000}{86} \approx 3000 + 406.98 = 3406.98$.
Therefore,the median lifetime of a lamp is $3406.98 \text{ hours}$.
| Life time | Number of lamps $(f_i)$ | Cumulative frequency $(cf)$ |
| $1500-2000$ | $14$ | $14$ |
| $2000-2500$ | $56$ | $70$ |
| $2500-3000$ | $60$ | $130$ |
| $3000-3500$ | $86$ | $216$ |
| $3500-4000$ | $74$ | $290$ |
| $4000-4500$ | $62$ | $352$ |
| $4500-5000$ | $48$ | $400$ |
Here,$n = 400$,so $\frac{n}{2} = 200$.
The cumulative frequency just greater than $200$ is $216$,which corresponds to the class interval $3000-3500$.
Thus,the median class is $3000-3500$.
Lower limit $(l)$ of the median class = $3000$.
Frequency $(f)$ of the median class = $86$.
Cumulative frequency $(cf)$ of the class preceding the median class = $130$.
Class size $(h)$ = $500$.
Using the median formula: $\text{Median} = l + \left( \frac{\frac{n}{2} - cf}{f} \right) \times h$
$\text{Median} = 3000 + \left( \frac{200 - 130}{86} \right) \times 500$
$\text{Median} = 3000 + \left( \frac{70}{86} \right) \times 500$
$\text{Median} = 3000 + \frac{35000}{86} \approx 3000 + 406.98 = 3406.98$.
Therefore,the median lifetime of a lamp is $3406.98 \text{ hours}$.
2 likes
View Solution29
Difficult
$100$ surnames were randomly picked up from a local telephone directory and the frequency distribution of the number of letters in the English alphabets in the surnames was obtained as follows:
Determine the median number of letters in the surnames. Find the mean number of letters in the surnames. Also,find the modal size of the surnames.
| Number of letters | $1-4$ | $4-7$ | $7-10$ | $10-13$ | $13-16$ | $16-19$ |
| Number of surnames | $6$ | $30$ | $40$ | $16$ | $4$ | $4$ |
Determine the median number of letters in the surnames. Find the mean number of letters in the surnames. Also,find the modal size of the surnames.
Solution
(N/A) The cumulative frequencies are as follows:
$1$. Median: $n=100$,so $n/2 = 50$. The cumulative frequency just greater than $50$ is $76$,which corresponds to the class $7-10$.
Median $= l + [(\frac{n}{2} - cf) / f] \times h = 7 + [(50 - 36) / 40] \times 3 = 7 + (14/40) \times 3 = 7 + 1.05 = 8.05$.
$2$. Mean: Using assumed mean $a = 11.5$ and $h = 3$,we calculate $x_i$ (midpoints): $2.5, 5.5, 8.5, 11.5, 14.5, 17.5$.
$u_i = (x_i - 11.5)/3$: $-3, -2, -1, 0, 1, 2$.
$f_i u_i$: $-18, -60, -40, 0, 4, 8$. Sum $\sum f_i u_i = -106$.
Mean $= a + h \times (\sum f_i u_i / \sum f_i) = 11.5 + 3 \times (-106/100) = 11.5 - 3.18 = 8.32$.
$3$. Mode: The modal class is $7-10$ (highest frequency $40$).
Mode $= l + [(f_1 - f_0) / (2f_1 - f_0 - f_2)] \times h = 7 + [(40 - 30) / (80 - 30 - 16)] \times 3 = 7 + (10/34) \times 3 = 7 + 0.88 = 7.88$.
| Number of letters | Frequency $(f)$ | Cumulative frequency $(cf)$ |
| $1-4$ | $6$ | $6$ |
| $4-7$ | $30$ | $36$ |
| $7-10$ | $40$ | $76$ |
| $10-13$ | $16$ | $92$ |
| $13-16$ | $4$ | $96$ |
| $16-19$ | $4$ | $100$ |
$1$. Median: $n=100$,so $n/2 = 50$. The cumulative frequency just greater than $50$ is $76$,which corresponds to the class $7-10$.
Median $= l + [(\frac{n}{2} - cf) / f] \times h = 7 + [(50 - 36) / 40] \times 3 = 7 + (14/40) \times 3 = 7 + 1.05 = 8.05$.
$2$. Mean: Using assumed mean $a = 11.5$ and $h = 3$,we calculate $x_i$ (midpoints): $2.5, 5.5, 8.5, 11.5, 14.5, 17.5$.
$u_i = (x_i - 11.5)/3$: $-3, -2, -1, 0, 1, 2$.
$f_i u_i$: $-18, -60, -40, 0, 4, 8$. Sum $\sum f_i u_i = -106$.
Mean $= a + h \times (\sum f_i u_i / \sum f_i) = 11.5 + 3 \times (-106/100) = 11.5 - 3.18 = 8.32$.
$3$. Mode: The modal class is $7-10$ (highest frequency $40$).
Mode $= l + [(f_1 - f_0) / (2f_1 - f_0 - f_2)] \times h = 7 + [(40 - 30) / (80 - 30 - 16)] \times 3 = 7 + (10/34) \times 3 = 7 + 0.88 = 7.88$.
0 likes
View Solution30
MediumMCQ
The distribution below gives the weights of $30$ students of a class. Find the median weight of the students.
| Weight (in kg) | $40-45$ | $45-50$ | $50-55$ | $55-60$ | $60-65$ | $65-70$ | $70-75$ |
| Number of students | $2$ | $3$ | $8$ | $6$ | $6$ | $3$ | $2$ |
A
$50$
B
$55$
C
$56.67$
D
$60$
Solution
(C) The cumulative frequencies with their respective class intervals are as follows:
Total number of students $n = 30$.
We calculate $\frac{n}{2} = \frac{30}{2} = 15$.
The cumulative frequency just greater than $15$ is $19$,which corresponds to the class interval $55-60$.
Thus,the median class is $55-60$.
Lower limit of the median class $(l)$ = $55$.
Frequency of the median class $(f)$ = $6$.
Cumulative frequency of the class preceding the median class $(cf)$ = $13$.
Class size $(h)$ = $5$.
Using the median formula: $\text{Median} = l + \left( \frac{\frac{n}{2} - cf}{f} \right) \times h$.
$\text{Median} = 55 + \left( \frac{15 - 13}{6} \right) \times 5$.
$\text{Median} = 55 + \left( \frac{2}{6} \right) \times 5 = 55 + \frac{10}{6} = 55 + 1.67 = 56.67$.
Therefore,the median weight of the students is $56.67 \text{ kg}$.
| Weight (in kg) | Frequency $(f_i)$ | Cumulative frequency $(cf)$ |
| $40-45$ | $2$ | $2$ |
| $45-50$ | $3$ | $5$ |
| $50-55$ | $8$ | $13$ |
| $55-60$ | $6$ | $19$ |
| $60-65$ | $6$ | $25$ |
| $65-70$ | $3$ | $28$ |
| $70-75$ | $2$ | $30$ |
Total number of students $n = 30$.
We calculate $\frac{n}{2} = \frac{30}{2} = 15$.
The cumulative frequency just greater than $15$ is $19$,which corresponds to the class interval $55-60$.
Thus,the median class is $55-60$.
Lower limit of the median class $(l)$ = $55$.
Frequency of the median class $(f)$ = $6$.
Cumulative frequency of the class preceding the median class $(cf)$ = $13$.
Class size $(h)$ = $5$.
Using the median formula: $\text{Median} = l + \left( \frac{\frac{n}{2} - cf}{f} \right) \times h$.
$\text{Median} = 55 + \left( \frac{15 - 13}{6} \right) \times 5$.
$\text{Median} = 55 + \left( \frac{2}{6} \right) \times 5 = 55 + \frac{10}{6} = 55 + 1.67 = 56.67$.
Therefore,the median weight of the students is $56.67 \text{ kg}$.
0 likes
View Solution31
Medium
The annual profits earned by $30$ shops of a shopping complex in a locality give rise to the following distribution:
Draw both ogives for the data above. Hence,obtain the median profit.
| Profit (Rs in lakhs) | Number of shops (frequency) |
| More than or equal to $5$ | $30$ |
| More than or equal to $10$ | $28$ |
| More than or equal to $15$ | $16$ |
| More than or equal to $20$ | $14$ |
| More than or equal to $25$ | $10$ |
| More than or equal to $30$ | $7$ |
| More than or equal to $35$ | $3$ |
Draw both ogives for the data above. Hence,obtain the median profit.
Solution
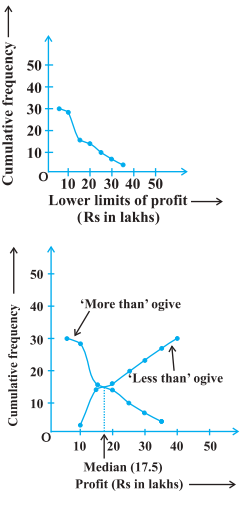
(17.5) To draw the 'more than' ogive,we plot the points $(5, 30), (10, 28), (15, 16), (20, 14), (25, 10), (30, 7),$ and $(35, 3)$ on a graph where the horizontal axis represents the lower limits of profit and the vertical axis represents the cumulative frequency. We join these points with a smooth curve.
Next,we convert the given data into a frequency distribution table:
To draw the 'less than' ogive,we plot the points $(10, 2), (15, 14), (20, 16), (25, 20), (30, 23), (35, 27),$ and $(40, 30)$ on the same axes.
The abscissa of the point of intersection of the two ogives gives the median. From the graph,the point of intersection is at $x = 17.5$. Therefore,the median profit is $Rs. 17.5$ lakhs.
Next,we convert the given data into a frequency distribution table:
| Classes | $5-10$ | $10-15$ | $15-20$ | $20-25$ | $25-30$ | $30-35$ | $35-40$ |
| No. of shops | $2$ | $12$ | $2$ | $4$ | $3$ | $4$ | $3$ |
| Cumulative frequency | $2$ | $14$ | $16$ | $20$ | $23$ | $27$ | $30$ |
To draw the 'less than' ogive,we plot the points $(10, 2), (15, 14), (20, 16), (25, 20), (30, 23), (35, 27),$ and $(40, 30)$ on the same axes.
The abscissa of the point of intersection of the two ogives gives the median. From the graph,the point of intersection is at $x = 17.5$. Therefore,the median profit is $Rs. 17.5$ lakhs.
0 likes
View Solution32
Medium
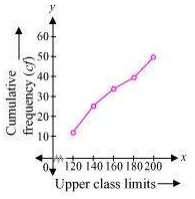
The following distribution gives the daily income of $50$ workers of a factory.
Convert the distribution above to a less than type cumulative frequency distribution,and draw its ogive.
| Daily income (in Rs.) | $100-120$ | $120-140$ | $140-160$ | $160-180$ | $180-200$ |
| Number of workers | $12$ | $14$ | $8$ | $6$ | $10$ |
Convert the distribution above to a less than type cumulative frequency distribution,and draw its ogive.
Solution
(N/A) The frequency distribution table of less than type is as follows:
Taking upper class limits of class intervals on the $x$-axis and their respective cumulative frequencies on the $y$-axis,the ogive is drawn by plotting the points $(120, 12), (140, 26), (160, 34), (180, 40),$ and $(200, 50)$ and joining them with a smooth curve.
| Daily income (in Rs.) (upper class limits) | Cumulative frequency |
| Less than $120$ | $12$ |
| Less than $140$ | $12 + 14 = 26$ |
| Less than $160$ | $26 + 8 = 34$ |
| Less than $180$ | $34 + 6 = 40$ |
| Less than $200$ | $40 + 10 = 50$ |
Taking upper class limits of class intervals on the $x$-axis and their respective cumulative frequencies on the $y$-axis,the ogive is drawn by plotting the points $(120, 12), (140, 26), (160, 34), (180, 40),$ and $(200, 50)$ and joining them with a smooth curve.
0 likes
View Solution33
Medium
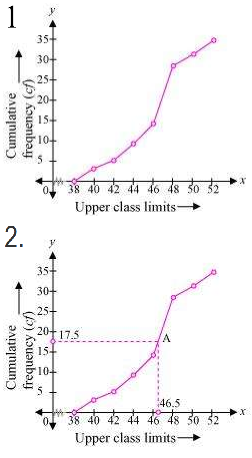
During the medical check-up of $35$ students of a class,their weights were recorded as follows:
Draw a less than type ogive for the given data. Hence,obtain the median weight from the graph and verify the result by using the formula.
| Weight (in kg) | Number of students |
|---|---|
| Less than $38$ | $0$ |
| Less than $40$ | $3$ |
| Less than $42$ | $5$ |
| Less than $44$ | $9$ |
| Less than $46$ | $14$ |
| Less than $48$ | $28$ |
| Less than $50$ | $32$ |
| Less than $52$ | $35$ |
Draw a less than type ogive for the given data. Hence,obtain the median weight from the graph and verify the result by using the formula.
Solution
(N/A) The given cumulative frequency distributions of less than type are:
Taking upper class limits on the $x$-axis and their respective cumulative frequencies on the $y$-axis,the ogive is drawn as shown in the figure.
Here,$n = 35$.
So,$\frac{n}{2} = 17.5$.
Mark the point $A$ on the curve whose ordinate is $17.5$. The $x$-coordinate corresponding to this point is $46.5$. Therefore,the median of this data is $46.5$.
To verify using the formula,we first determine the class intervals and their frequencies:
The cumulative frequency just greater than $\frac{n}{2} = 17.5$ is $28$,which belongs to the class interval $46-48$.
Median class $= 46-48$.
Lower class limit $(l) = 46$.
Frequency $(f) = 14$.
Cumulative frequency of the class preceding the median class $(cf) = 14$.
Class size $(h) = 2$.
Using the median formula:
$\text{Median} = l + \left( \frac{\frac{n}{2} - cf}{f} \right) \times h$
$= 46 + \left( \frac{17.5 - 14}{14} \right) \times 2$
$= 46 + \left( \frac{3.5}{14} \right) \times 2$
$= 46 + \frac{7}{14} = 46 + 0.5 = 46.5$.
The result is verified.
| Weight (in kg) (upper class limits) | Number of students (cumulative frequency) |
|---|---|
| Less than $38$ | $0$ |
| Less than $40$ | $3$ |
| Less than $42$ | $5$ |
| Less than $44$ | $9$ |
| Less than $46$ | $14$ |
| Less than $48$ | $28$ |
| Less than $50$ | $32$ |
| Less than $52$ | $35$ |
Taking upper class limits on the $x$-axis and their respective cumulative frequencies on the $y$-axis,the ogive is drawn as shown in the figure.
Here,$n = 35$.
So,$\frac{n}{2} = 17.5$.
Mark the point $A$ on the curve whose ordinate is $17.5$. The $x$-coordinate corresponding to this point is $46.5$. Therefore,the median of this data is $46.5$.
To verify using the formula,we first determine the class intervals and their frequencies:
| Weight (in kg) | Frequency $(f)$ | Cumulative frequency $(cf)$ |
|---|---|---|
| $38-40$ | $3-0=3$ | $3$ |
| $40-42$ | $5-3=2$ | $5$ |
| $42-44$ | $9-5=4$ | $9$ |
| $44-46$ | $14-9=5$ | $14$ |
| $46-48$ | $28-14=14$ | $28$ |
| $48-50$ | $32-28=4$ | $32$ |
| $50-52$ | $35-32=3$ | $35$ |
The cumulative frequency just greater than $\frac{n}{2} = 17.5$ is $28$,which belongs to the class interval $46-48$.
Median class $= 46-48$.
Lower class limit $(l) = 46$.
Frequency $(f) = 14$.
Cumulative frequency of the class preceding the median class $(cf) = 14$.
Class size $(h) = 2$.
Using the median formula:
$\text{Median} = l + \left( \frac{\frac{n}{2} - cf}{f} \right) \times h$
$= 46 + \left( \frac{17.5 - 14}{14} \right) \times 2$
$= 46 + \left( \frac{3.5}{14} \right) \times 2$
$= 46 + \frac{7}{14} = 46 + 0.5 = 46.5$.
The result is verified.
0 likes
View Solution34
Medium
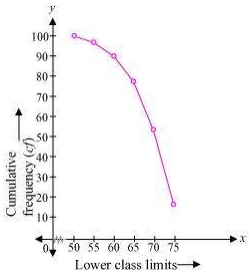
The following table gives the production yield per hectare of wheat of $100$ farms of a village.
Change the distribution to a 'more than type' distribution,and draw its ogive.
| Production yield (in kg/ha) | Number of farms |
|---|---|
| $50-55$ | $2$ |
| $55-60$ | $8$ |
| $60-65$ | $12$ |
| $65-70$ | $24$ |
| $70-75$ | $38$ |
| $75-80$ | $16$ |
Change the distribution to a 'more than type' distribution,and draw its ogive.
Solution
(N/A) The cumulative frequency distribution of 'more than type' can be obtained as follows:
By plotting the points $(50, 100), (55, 98), (60, 90), (65, 78), (70, 54), (75, 16)$ on a graph paper,taking the lower class limits on the $x$-axis and their respective cumulative frequencies on the $y$-axis,we obtain the 'more than type' ogive.
| Production yield (lower class limits) | Cumulative frequency |
|---|---|
| More than or equal to $50$ | $100$ |
| More than or equal to $55$ | $100 - 2 = 98$ |
| More than or equal to $60$ | $98 - 8 = 90$ |
| More than or equal to $65$ | $90 - 12 = 78$ |
| More than or equal to $70$ | $78 - 24 = 54$ |
| More than or equal to $75$ | $54 - 38 = 16$ |
By plotting the points $(50, 100), (55, 98), (60, 90), (65, 78), (70, 54), (75, 16)$ on a graph paper,taking the lower class limits on the $x$-axis and their respective cumulative frequencies on the $y$-axis,we obtain the 'more than type' ogive.
0 likes
View SolutionStatistics — Textbook - Statistics · Frequently Asked Questions
1Are these Statistics questions useful for JEE and NEET?
Yes. All questions in this section are mapped to JEE Main and NEET exam patterns. Previous year questions from JEE Main, NEET, GUJCET and state-level exams are included with full solutions.
2Can I switch to Hindi or Gujarati for these questions?
Yes. Use the language tabs in the hero section or the sidebar to view the same questions and solutions in English, Hindi or Gujarati.
3How do I generate a question paper from this subtopic?
Use the Vedclass Exam Paper Generator — select the chapter and subtopic, set difficulty, and generate Sets A, B, C, D automatically. First 3 chapters of every subject are free.
Vedclass Products
For Students
Vedclass Test Series
Mock tests in real JEE/NEET style with performance analysis. 5-day free trial.
Start Free TrialFor Teachers
Exam Paper Generator
Generate Set A/B/C/D papers from this chapter in 2 minutes. 3 chapters free.
Try FreeFor Institutes
Online Exam Module
Live online exams with unlimited students, 360° analytics & white-label branding.
See DemoFor Teachers & Institutes
Generate a Statistics Exam Paper in 2 Minutes
Select subtopic & difficulty — Sets A, B, C, D auto-generated with No Repeat logic.
First 3 chapters of every subject are free — no payment required.