
A English
Population Growth Questions in English
Class 12 Biology · Organisms and Populations · Population Growth
195+
Questions
English
Language
100%
With Solutions
Showing 45 of 195 questions in English
151
MediumMCQ
$A$: Environmental resistance operates to slow down the exponential phase in logistic population growth.
$R$: $A$ crash phase does not occur in this population.
$R$: $A$ crash phase does not occur in this population.
A
Assertion and Reason both are correct and Reason is the correct explanation of Assertion.
B
Assertion and Reason both are correct but Reason is not the correct explanation of Assertion.
C
Assertion is correct,but Reason is incorrect.
D
Both Assertion and Reason are incorrect.
Solution
(B) In a logistic growth model,the population growth is initially exponential but slows down as it approaches the carrying capacity $(K)$ due to environmental resistance.
Therefore,the Assertion is correct.
However,a 'crash phase' (a sudden,sharp decline in population size) is characteristic of $J$-shaped growth curves (exponential growth) where resources are exhausted rapidly,not the $S$-shaped logistic growth curve.
Thus,the statement that a crash phase does not occur in a logistic population is correct.
Since both statements are true but the absence of a crash phase is not the reason why environmental resistance slows down the exponential phase,the correct option is $B$.
0 likes
View Solution152
MediumMCQ
In the exponential growth equation $N_{t}=N_{0} e^{rt}$,$e$ represents :
A
The base of number logarithms
B
The base of exponential logarithms
C
The base of natural logarithms
D
The base of geometric logarithms
Solution
(C) The exponential growth equation is given by $N_{t} = N_{0} e^{rt}$.
In this equation,$N_{t}$ is the population density at time $t$,$N_{0}$ is the population density at time zero,$r$ is the intrinsic rate of natural increase,and $t$ is the time period.
The symbol $e$ represents the base of natural logarithms,which is an irrational mathematical constant approximately equal to $2.71828$.
0 likes
View Solution153
EasyMCQ
Give scientific reasons: When a plant culture is grown in a limited amount of nutrient medium,growth is slow in the initial stage (lag phase). It increases rapidly in the exponential phase and again slows down in the stationary phase.
A
Due to high competition for space.
B
Due to the accumulation of toxic waste products.
C
Due to the depletion of nutrients and accumulation of metabolic waste.
D
Due to the lack of light.
Solution
(C) In a limited nutrient medium,the growth curve follows a sigmoid pattern.
$1$. Lag phase: Initially,the number of cells is small,and they are adapting to the new environment,resulting in slow growth.
$2$. Exponential phase: Once adapted,cells divide rapidly using the available nutrients,leading to a logarithmic increase in population.
$3$. Stationary phase: As nutrients become depleted and metabolic waste products accumulate,the growth rate slows down and eventually plateaus.
0 likes
View Solution154
Medium
What are the factors affecting population growth?
Solution
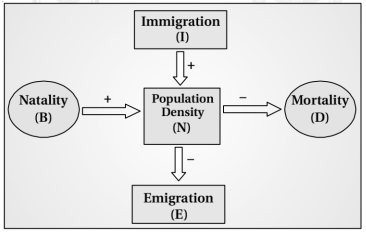
(N/A) The size of a population is not static. It keeps changing with time,depending on factors such as food availability,predation pressure,and weather conditions. The four main factors that determine population growth are:
$1$. Natality $(B)$: The number of births during a given period in the population.
$2$. Mortality $(D)$: The number of deaths during a given period in the population.
$3$. Immigration $(I)$: The number of individuals of the same species that have come into the habitat from elsewhere during a given period.
$4$. Emigration $(E)$: The number of individuals of the population who left the habitat and gone elsewhere during a given period.
If $N$ is the population density at time $t$,then its density at time $t+1$ is given by the equation:
$N_{t+1} = N_t + [(B + I) - (D + E)]$
Population density will increase if the number of births plus the number of immigrants $(B + I)$ is more than the number of deaths plus the number of emigrants $(D + E)$; otherwise,it will decrease.
0 likes
View Solution155
Medium
What is meant by growth models?
Solution
(A) $\Rightarrow$ Growth models represent the specific and predictable patterns of population growth over time.
Population growth occurs based on the availability of food, habitat conditions, and the presence of other biotic and abiotic factors.
There are two main types of models:
$(a)$ Exponential Growth: This type of growth occurs when food and space are available in sufficient amounts.
When resources in the habitat are unlimited, each species has the ability to realize its innate potential to grow in number fully.
- The population grows in an exponential or geometric fashion.
If in a population of size $N$, the birth rate is represented as '$b$' and the death rate as '$d$'.
$\Rightarrow$ Then the increase or decrease in $N$ during a unit time period '$t$' will be $dN/dt = (b-d) \times N$.
Let $(b-d) = r$, then $dN/dt = rN$.
Here, '$r$' is called the 'intrinsic rate of natural increase' and is a very important parameter for assessing the impacts of any biotic or abiotic factor on population growth.
To provide an idea of the magnitude of '$r$' values: for the Norway rat, '$r$' is $0.015$, and for the flour beetle, it is $0.12$.
In $1981$, the '$r$' value for the human population in India was $0.0205$.
The above equation describes the exponential or geometric growth pattern of a population and results in a $J$-shaped curve when $N$ is plotted in relation to time.
Using basic calculus, the integral form of the exponential growth equation is $N_t = N_0 e^{rt}$.
Where $N_t = \text{Population density after time } t$, $N_0 = \text{Population density at time zero}$, $r = \text{intrinsic rate of natural increase}$, and $e = \text{the base of natural logarithms } (2.71828)$.
Any species growing exponentially under unlimited resource conditions can reach enormous population densities in a short time.
Darwin showed how even a slow-growing animal like an elephant could reach enormous numbers in the absence of checks.
$(b)$ Logistic Growth: No population of any species in nature has unlimited resources at its disposal to permit exponential growth.
This leads to competition between individuals for limited resources. Eventually, the 'fittest' individual will survive and reproduce.
Many governments have realized this fact and introduced various restraints to limit human population growth.
In nature, a given habitat has enough resources to support a maximum possible number, beyond which no further growth is possible.
0 likes
View Solution156
MediumMCQ
What is Darwinian fitness?
A
The ability of an organism to survive in harsh conditions.
B
The measure of an organism's reproductive success in its environment.
C
The physical strength of an organism to compete for resources.
D
The capacity of an organism to live for a long duration.
Solution
(B) Darwinian fitness is defined as the measure of an organism's reproductive success in its environment.
- Populations evolve to maximize their reproductive fitness in the habitat in which they live.
- Under a particular set of selection pressures,organisms evolve towards the most efficient reproductive strategy.
- Some organisms breed only once in their lifetime (e.g.,Pacific salmon fish,bamboo).
- Some reproduce many times during their lifetime (e.g.,most birds and mammals).
- Some organisms produce a large number of small-sized offspring (e.g.,oyster,pelagic fishes).
- Some organisms produce a small number of large-sized offspring (e.g.,birds,mammals).
- Life history traits of organisms have evolved in relation to the constraints imposed by the biotic and abiotic components of the habitat in which they live.
0 likes
View Solution157
Medium
Give the differences between $S$-shaped and $J$-shaped growth curves.
Solution
(N/A)
| $S$-shaped growth curve (Sigmoid) | $J$-shaped growth curve |
| $(1)$ It consists of $5$ phases: lag phase,positive acceleration phase,exponential phase,negative acceleration phase,and stationary phase. | $(1)$ It consists of $2$ phases: lag phase and exponential phase. |
| $(2)$ Finally,the population reaches a steady state where the growth rate becomes zero because the birth rate equals the death rate. | $(2)$ Finally,the population crashes due to a rapid increase in mortality rate or resource exhaustion. |
| $(3)$ Example: Yeast cells in a culture medium. | $(3)$ Example: Reindeers,algal blooms,or lemmings in the Tundra. |
0 likes
View Solution158
MediumMCQ
If the population density at time $t$ is $N_t$,then the population density at time $t+1$ is given by:
A
$N_t = N_{t+1} + [(B + I) - (D + E)]$
B
$N_t = N_{t+1} + [(B + I) - (D - E)]$
C
$N_{t+1} = N_t + [(B + I) - (D + E)]$
D
$N_{t+1} = N_t + [(B + I) - (D - E)]$
Solution
(C) Population density at time $t+1$ $(N_{t+1})$ is calculated by adding the births $(B)$ and immigration $(I)$ to the initial population $(N_t)$ and subtracting the deaths $(D)$ and emigration $(E)$.
Mathematically,this is represented as: $N_{t+1} = N_t + [(B + I) - (D + E)]$.
Here,$B$ represents births,$I$ represents immigration,$D$ represents deaths,and $E$ represents emigration.
Mathematically,this is represented as: $N_{t+1} = N_t + [(B + I) - (D + E)]$.
Here,$B$ represents births,$I$ represents immigration,$D$ represents deaths,and $E$ represents emigration.
0 likes
View Solution159
MediumMCQ
The formula $N_t = N_0 e^{rt}$ represents which type of growth?
A
Exponential growth
B
Logistic growth
C
Verhulst-Pearl growth
D
Both $B$ and $C$
Solution
(A) The equation $N_t = N_0 e^{rt}$ is the mathematical representation of exponential growth.
In this formula:
$N_t$ is the population density after time $t$.
$N_0$ is the population density at time zero.
$r$ is the intrinsic rate of natural increase.
$e$ is the base of natural logarithms (approximately $2.718$).
Logistic growth,also known as Verhulst-Pearl growth,is represented by a different equation: $dN/dt = rN(K-N/K)$.
0 likes
View Solution160
MediumMCQ
The equation $\frac{dN}{dt} = rN \left(\frac{K - N}{K}\right)$ represents which of the following?
A
Exponential growth
B
Logistic growth
C
Verhulst-Pearl growth
D
Both $B$ and $C$
0 likes
View Solution161
MediumMCQ
Match the following columns:
| Column-$I$ (Value of $r$) | Column-$II$ (Example) |
| $P. 0.12$ | $I$. Flour beetle |
| $Q. 0.015$ | $II$. Norway rat |
| $R. 0.0205$ | $III$. Human population in India in $1981$ |
A
$(P-II), (Q-I), (R-III)$
B
$(P-I), (Q-III), (R-II)$
C
$(P-II), (Q-III), (R-I)$
D
$(P-I), (Q-II), (R-III)$
Solution
(D) According to the $NCERT$ textbook data for population growth rate $(r)$:
$1$. The value of $r$ for the Norway rat is $0.015$.
$2$. The value of $r$ for the flour beetle is $0.12$.
$3$. The value of $r$ for the human population in India in $1981$ is $0.0205$.
Therefore, the correct matching is:
$P$ (Flour beetle) = $0.12$ $(I)$
$Q$ (Norway rat) = $0.015$ $(II)$
$R$ (Human population in India in $1981$) = $0.0205$ $(III)$
Thus, the correct sequence is $(P-I), (Q-II), (R-III)$.
0 likes
View Solution162
MediumMCQ
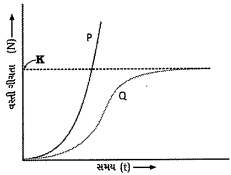
The population growth curves are given below. Identify the equations for $P$ and $Q$.
A
$\frac{dN}{dt} = rN \left(\frac{K - N}{K}\right) \quad \frac{dN}{dt} = rN$
B
$\frac{dN}{dt} = rN \quad \frac{dN}{dt} = rN \left(\frac{K - N}{K}\right)$
C
$\frac{dN}{dt} = rN \quad \frac{dN}{dt} = rN \left(\frac{N - K}{K}\right)$
D
$\frac{dN}{dt} = rN \left(\frac{N - K}{K}\right) \quad \frac{dN}{dt} = rN$
Solution
(B) The graph shows two types of population growth curves:
$1$. Curve $P$ represents exponential growth,which occurs when resources are unlimited. The equation for exponential growth is $\frac{dN}{dt} = rN$.
$2$. Curve $Q$ represents logistic growth,which occurs when resources are limited,leading to a carrying capacity $(K)$. The equation for logistic growth is $\frac{dN}{dt} = rN \left(\frac{K - N}{K}\right)$.
Therefore,the correct equations for $P$ and $Q$ are $\frac{dN}{dt} = rN$ and $\frac{dN}{dt} = rN \left(\frac{K - N}{K}\right)$ respectively.
0 likes
View Solution163
MediumMCQ
Identify the phases of the Verhulst-Pearl logistic growth curve in sequence.
A
Lag phase $\rightarrow$ Positive acceleration phase $\rightarrow$ Negative acceleration phase $\rightarrow$ Asymptote
B
Positive acceleration phase $\rightarrow$ Lag phase $\rightarrow$ Negative acceleration phase $\rightarrow$ Asymptote
C
Negative acceleration phase $\rightarrow$ Lag phase $\rightarrow$ Positive acceleration phase $\rightarrow$ Asymptote
D
Lag phase $\rightarrow$ Negative acceleration phase $\rightarrow$ Positive acceleration phase $\rightarrow$ Asymptote
Solution
(A) The Verhulst-Pearl logistic growth model describes population growth in an environment with limited resources.
It follows a sigmoid curve consisting of the following phases in sequence:
$1$. Lag phase: Initial phase where the population grows slowly as individuals adapt to the environment.
$2$. Positive acceleration phase: The population grows rapidly as resources are abundant.
$3$. Negative acceleration phase: Growth rate slows down due to environmental resistance (competition for resources).
$4$. Asymptote (Stationary phase): The population reaches the carrying capacity $(K)$ of the environment,where birth rates equal death rates.
0 likes
View Solution164
MediumMCQ
The intrinsic rate of natural increase is represented by which of the following?
A
$b$
B
$d$
C
$b-d$
D
$r$
Solution
(D) In population ecology,the intrinsic rate of natural increase is denoted by the symbol $r$.
It is calculated as the difference between the birth rate $(b)$ and the death rate $(d)$.
Therefore,the formula is $r = b - d$.
This value is a critical parameter for assessing the impacts of any biotic or abiotic factor on population growth.
It is calculated as the difference between the birth rate $(b)$ and the death rate $(d)$.
Therefore,the formula is $r = b - d$.
This value is a critical parameter for assessing the impacts of any biotic or abiotic factor on population growth.
0 likes
View Solution165
MediumMCQ
The equation of Verhulst-Pearl logistic growth is $\frac{dN}{dt}=rN\left[\frac{K-N}{K}\right]$. From this equation,$K$ indicates:
A
Biotic potential
B
Carrying capacity
C
Population density
D
Intrinsic rate of natural increase
Solution
(B) In the Verhulst-Pearl logistic growth equation,$\frac{dN}{dt} = rN \left( \frac{K-N}{K} \right)$:
- $\frac{dN}{dt}$ represents the rate of change in population size over time.
- $N$ represents the population density at time $t$.
- $r$ represents the intrinsic rate of natural increase.
- $K$ represents the carrying capacity,which is the maximum population size that an environment can sustain given the available resources.
0 likes
View Solution166
MediumMCQ
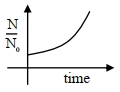
For bacterial growth in a cell culture,the growth law is very similar to the law of radioactive decay. Which of the following graphs is most suitable to represent bacterial colony growth?
A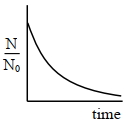
B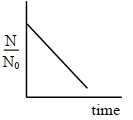
C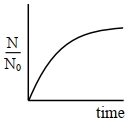
D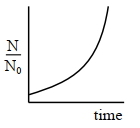
Solution
(D) In a cell culture,bacteria undergo exponential growth,which is represented by the equation $N = N_0 e^{Kt}$,where $N$ is the number of bacteria at time $t$,$N_0$ is the initial number of bacteria,and $K$ is the growth constant.
This equation represents an exponential increase over time.
Among the given options,the graph that shows an exponential increase in the ratio $N/N_0$ with respect to time is represented by option $D$.
This equation represents an exponential increase over time.
Among the given options,the graph that shows an exponential increase in the ratio $N/N_0$ with respect to time is represented by option $D$.
0 likes
View Solution167
EasyMCQ
Which one of the following equations represents the Verhulst$-$Pearl Logistic Growth of population?
A
$\frac{dN}{dt} = r \left( \frac{K-N}{K} \right)$
B
$\frac{dN}{dt} = rN \left( \frac{K-N}{K} \right)$
C
$\frac{dN}{dt} = rN \left( \frac{N-K}{N} \right)$
D
$\frac{dN}{dt} = N \left( \frac{r-K}{K} \right)$
Solution
(B) The Verhulst$-$Pearl Logistic Growth model describes population growth in an environment with limited resources.
In this model,the population growth rate $\frac{dN}{dt}$ is given by the equation $\frac{dN}{dt} = rN \left( \frac{K-N}{K} \right)$.
Here,$N$ represents the population density at time $t$,$r$ is the intrinsic rate of natural increase,and $K$ is the carrying capacity of the environment.
This equation shows that as $N$ approaches $K$,the term $\left( \frac{K-N}{K} \right)$ approaches zero,causing the population growth to slow down and eventually stabilize at the carrying capacity.
0 likes
View Solution168
MediumMCQ
The formula for exponential population growth is $:-$
A
$dN / dt = rN$
B
$dt / dN = rN$
C
$dN / N = rdt$
D
$rN / dN = dt$
Solution
(A) Exponential growth occurs when resources are unlimited in the habitat.
In this model,the population size $(N)$ increases at a rate proportional to the current population size.
The rate of change of population size with respect to time is given by the differential equation:
$dN / dt = rN$
Where:
$N$ = Population size
$t$ = Time
$r$ = Intrinsic rate of natural increase.
Therefore,option $A$ is the correct formula.
0 likes
View Solution169
MediumMCQ
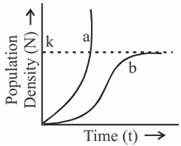
Read the following curve and identify what '$b$' indicates.
A
Carrying capacity,$\frac{dN}{dt} = rN \left(\frac{K - N}{K}\right)$
B
Exponential growth,$N_t = N_0 e^{rt}$
C
Logistic growth,$N_t = N_0 e^{rt}$
D
Logistic growth,$\frac{dN}{dt} = rN \left(\frac{K - N}{K}\right)$
Solution
(D) In the given population growth curve:
$1$. Curve '$a$' represents exponential growth,which occurs when resources are unlimited.
$2$. Curve '$b$' represents logistic growth,which occurs when resources are limited,leading to a sigmoid ($S$-shaped) curve.
$3$. The equation for logistic growth is $\frac{dN}{dt} = rN \left(\frac{K - N}{K}\right)$,where '$K$' is the carrying capacity.
$4$. Therefore,'$b$' indicates logistic growth,represented by the Verhulst-Pearl logistic growth equation.
0 likes
View Solution170
MediumMCQ
Given below are two statements:
Statement-$I$: $A$ population growing in a habitat with limited resources shows initially a lag phase.
Statement-$II$: $A$ population growing in a habitat with limited resources shows finally an asymptote phase.
Statement-$I$: $A$ population growing in a habitat with limited resources shows initially a lag phase.
Statement-$II$: $A$ population growing in a habitat with limited resources shows finally an asymptote phase.
A
Both Statement-$I$ and Statement-$II$ are incorrect.
B
Statement-$I$ is correct but Statement-$II$ is incorrect.
C
Statement-$I$ is incorrect but Statement-$II$ is correct.
D
Both Statement-$I$ and Statement-$II$ are correct.
Solution
(D) In a habitat with limited resources,population growth follows a logistic growth model (Sigmoid curve).
$1$. The logistic growth curve starts with a lag phase,where the population adapts to the new environment and growth is slow.
$2$. This is followed by a log phase (exponential phase) and finally a stationary phase (asymptote),where the population size reaches the carrying capacity $(K)$ of the habitat.
Therefore,both Statement-$I$ and Statement-$II$ are correct.
0 likes
View Solution171
MediumMCQ
The magnitude of $r$-value (intrinsic rate of natural increase) for the Norway rat is:
A
$0.015$
B
$0.12$
C
$0.15$
D
$1.5$
Solution
(A) The $r$-value represents the intrinsic rate of natural increase,which is a critical parameter for assessing impacts of any biotic or abiotic factor on population growth.
According to the $NCERT$ Biology textbook,the $r$-value for the Norway rat is $0.015$.
Therefore,the correct option is $A$.
According to the $NCERT$ Biology textbook,the $r$-value for the Norway rat is $0.015$.
Therefore,the correct option is $A$.
0 likes
View Solution172
EasyMCQ
In the logistic growth equation $dN/dt = rN[(K-N)/K]$,'$r$' represents :-
A
Extrinsic rate of natural increase
B
The base of natural logarithms
C
Intrinsic rate of natural increase
D
Carrying capacity
Solution
(C) In the logistic growth model,the equation is given by $dN/dt = rN[(K-N)/K]$.
Here,$dN/dt$ represents the rate of change in population size over time.
$N$ is the population density at time $t$.
$K$ is the carrying capacity,which is the maximum population size an environment can sustain.
'$r$' stands for the 'Intrinsic rate of natural increase',which is a critical parameter assessing the impact of biotic and abiotic factors on population growth.
0 likes
View Solution173
EasyMCQ
If $N$ is the population density at time $t$,then at time $t + 1$,the density is calculated as . . . . . . .
A
$N_{t+1}=N_t+[(B+I)+(D+E)]$
B
$N_{t+1}=N_t+[(B-I)+(D-E)]$
C
$N_{t+1}=N_t+[(B+I)-(D+E)]$
D
$N_{t+1}=N_t-[(B+I)-(D+E)]$
Solution
(C) The population density at time $t+1$ is determined by the initial population density at time $t$ plus the number of individuals added to the population minus the number of individuals removed from the population.
Births $(B)$ and Immigration $(I)$ increase the population density.
Deaths $(D)$ and Emigration $(E)$ decrease the population density.
Therefore,the formula is $N_{t+1} = N_t + [(B + I) - (D + E)]$.
Births $(B)$ and Immigration $(I)$ increase the population density.
Deaths $(D)$ and Emigration $(E)$ decrease the population density.
Therefore,the formula is $N_{t+1} = N_t + [(B + I) - (D + E)]$.
0 likes
View Solution174
EasyMCQ
Which one of the following is $INCORRECT$ about the logistic growth model?
A
Only the fittest individuals will survive and reproduce in limited resources.
B
The rate of growth accelerates after the initial log phase.
C
In nature,a given habitat has enough resources to support any number of species,but the growth is limited.
D
For animal populations,the logistic growth model is considered a more realistic one.
Solution
(C) The logistic growth model is based on the concept of carrying capacity $(K)$.
In nature,a given habitat has enough resources to support only a maximum possible number of individuals,beyond which no further growth is possible.
Therefore,the statement that a habitat can support 'any number of species' is incorrect,as resources are finite and limited by the carrying capacity of the environment.
0 likes
View Solution175
EasyMCQ
Given below are two statements.
Statement $I$: Under unlimited resource conditions,every species is capable of growing exponentially.
Statement $II$: $A$ population growing in a habitat with limited resources initially shows a very slow rate of growth.
In the light of the above statements,choose the correct option.
Statement $I$: Under unlimited resource conditions,every species is capable of growing exponentially.
Statement $II$: $A$ population growing in a habitat with limited resources initially shows a very slow rate of growth.
In the light of the above statements,choose the correct option.
A
Both statement $I$ and statement $II$ are correct.
B
Both statement $I$ and statement $II$ are incorrect.
C
Statement $I$ is correct but statement $II$ is incorrect.
D
Statement $I$ is incorrect but statement $II$ is correct.
Solution
(A) Statement $I$ is correct: When resources are unlimited,each species has the innate ability to realize its full potential to grow in number,resulting in exponential growth.
Statement $II$ is correct: In a habitat with limited resources,a population initially shows a lag phase where the growth rate is very slow as the population adapts to the environment before entering the log phase.
Statement $II$ is correct: In a habitat with limited resources,a population initially shows a lag phase where the growth rate is very slow as the population adapts to the environment before entering the log phase.
0 likes
View Solution176
EasyMCQ
$A$ population in a habitat with limited resources shows four phases of growth. Identify the correct sequence of growth.
A
Acceleration $\rightarrow$ deceleration $\rightarrow$ Lag phase $\rightarrow$ asymptote
B
Lag phase $\rightarrow$ acceleration $\rightarrow$ deceleration $\rightarrow$ asymptote
C
Lag phase $\rightarrow$ asymptote $\rightarrow$ deceleration $\rightarrow$ Acceleration $\rightarrow$ lag phase
D
Acceleration $\rightarrow$ lag phase $\rightarrow$ deceleration $\rightarrow$ asymptote
Solution
(B) In a habitat with limited resources,population growth follows a logistic growth model (Sigmoid curve).
$1$. Lag phase: The initial phase where the population adapts to the environment and growth is slow.
$2$. Acceleration phase: The population size increases rapidly as resources are abundant.
$3$. Deceleration phase: As resources become limited,the growth rate begins to slow down.
$4$. Asymptote: The population density reaches the carrying capacity $(K)$ of the environment,and growth stabilizes.
0 likes
View Solution177
EasyMCQ
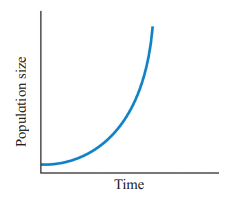
The above graph indicates . . . . . . with relation to population.
A
Growth curve with limited resources
B
Exponential growth
C
Arithmetical growth
D
Decelerating growth
Solution
(B) The graph shows a $J$-shaped curve,which is characteristic of exponential population growth.
In exponential growth,when resources are unlimited,each species has the ability to realize fully its innate potential to grow in number.
This results in a population growth curve that is $J$-shaped,represented by the equation $\frac{dN}{dt} = rN$,where $N$ is the population size,$t$ is time,and $r$ is the intrinsic rate of natural increase.
0 likes
View Solution178
EasyMCQ
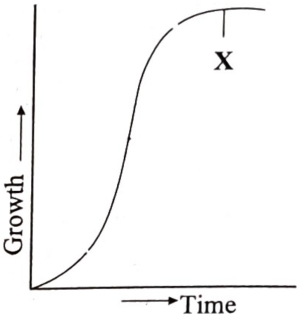
In the given figure of the growth curve,identify the phase marked as '$X$'.
A
Lag phase
B
Stationary phase
C
Log phase
D
Diminishing growth
Solution
(B) The provided graph represents a sigmoid growth curve,which is characteristic of population growth in an environment with limited resources.
$1$. The initial slow growth phase is the 'Lag phase'.
$2$. The phase of rapid exponential growth is the 'Log phase' or 'Exponential phase'.
$3$. The phase where the growth rate levels off and becomes constant as the population reaches the carrying capacity of the environment is the 'Stationary phase'.
$4$. In the given figure,'$X$' points to the plateau region where the population size stabilizes,which corresponds to the 'Stationary phase'.
0 likes
View Solution179
EasyMCQ
Verhulst-Pearl logistic growth shows . . . . . . curve.
A
$L$-shaped
B
$I$-shaped
C
$J$-shaped
D
$S$-shaped
Solution
(D) The Verhulst-Pearl logistic growth model describes population growth in an environment with limited resources.
When population density is plotted against time,it initially shows a lag phase,followed by an exponential phase,and finally a deceleration phase as it reaches the carrying capacity $(K)$.
This pattern results in a sigmoid or $S$-shaped curve,which is mathematically represented by the equation $\frac{dN}{dt} = rN \left( \frac{K-N}{K} \right)$.
0 likes
View Solution180
EasyMCQ
If $N$ is the population density at time $t$,then its density at time $t+1$ can be calculated as . . . . . . .
A
$N_{t+1} = N_t + [(B + I) - (D + E)]$
B
$N_{t+1} = N_t + [(B + E) - (I + D)]$
C
$N_{t+1} = N_t + [(B + D) - (I + E)]$
D
$N_{t+1} = N_t + [(I + E) - (B + D)]$
Solution
(A) The population density at time $t+1$ is determined by the initial density at time $t$ plus the additions to the population and minus the losses from the population.
Additions to the population occur through Births $(B)$ and Immigration $(I)$.
Losses from the population occur through Deaths $(D)$ and Emigration $(E)$.
Therefore,the formula is $N_{t+1} = N_t + [(B + I) - (D + E)]$.
Additions to the population occur through Births $(B)$ and Immigration $(I)$.
Losses from the population occur through Deaths $(D)$ and Emigration $(E)$.
Therefore,the formula is $N_{t+1} = N_t + [(B + I) - (D + E)]$.
0 likes
View Solution181
EasyMCQ
Phase of accelerated growth of logistic growth curve is . . . . . . .
A
Log phase
B
Diminishing growth phase
C
Lag phase
D
Stationary phase.
Solution
(A) The logistic growth curve exhibits a sigmoid shape consisting of three distinct phases:
$1$. Lag phase: The initial phase of slow and diminished growth.
$2$. Log phase (Exponential phase): The phase of accelerated growth where the population increases rapidly.
$3$. Stationary phase: The final phase where growth levels off due to environmental resistance.
$1$. Lag phase: The initial phase of slow and diminished growth.
$2$. Log phase (Exponential phase): The phase of accelerated growth where the population increases rapidly.
$3$. Stationary phase: The final phase where growth levels off due to environmental resistance.
0 likes
View Solution182
EasyMCQ
$A$ given habitat has enough resources to support a maximum possible number of a species. This limit beyond which no further growth is possible is called its . . . . . . for that species.
A
Carrying capacity
B
Fundamental niche
C
Realized niche
D
Biome
Solution
(A) In ecology,the maximum population size of a biological species that can be sustained in a specific environment,given the food,habitat,water,and other resources available,is known as the $Carrying \ capacity$ $(K)$.
If the population exceeds this limit,the resources become insufficient,leading to a decline in the population until it stabilizes at or below this capacity.
Therefore,the limit beyond which no further growth is possible is called the $Carrying \ capacity$.
If the population exceeds this limit,the resources become insufficient,leading to a decline in the population until it stabilizes at or below this capacity.
Therefore,the limit beyond which no further growth is possible is called the $Carrying \ capacity$.
0 likes
View Solution183
EasyMCQ
Exponential growth of a species can be expressed as:
A
$L_1 = L_0 + rt$
B
$L_e = L_t rt$
C
$N_t = N_0 e^{rt}$
D
$N_t = N_0 ert$
Solution
(C) The equation for exponential growth is $N_t = N_0 e^{rt}$.
Here,$N_t$ represents the population density after time $t$.
$N_0$ is the initial population density.
$r$ is the intrinsic rate of natural increase.
$e$ is the base of natural logarithms (approximately $2.718$).
This equation describes a population growing exponentially when resources are unlimited.
0 likes
View Solution184
EasyMCQ
The exponential growth equation is $N_{t} = N_{0}e^{rt}$,where $N_{t}$ is the population density after time $t$. What do $N_{0}$ and $r$ refer to,respectively?
A
Population density at time zero,intrinsic rate of natural increase,$e$ = the base of natural logarithms
B
Intrinsic rate of natural increase,the base of natural logarithm,population density at time zero
C
Population density at time zero,the base of natural logarithm,intrinsic rate of natural increase
D
The base of natural logarithm,intrinsic rate of natural increase,population density at time zero
Solution
(A) In the exponential growth equation $N_{t} = N_{0}e^{rt}$:
$1$. $N_{t}$ represents the population density after time $t$.
$2$. $N_{0}$ represents the population density at time zero (initial population).
$3$. $r$ represents the intrinsic rate of natural increase.
$4$. $e$ represents the base of natural logarithms (approximately $2.71828$).
Therefore,$N_{0}$ refers to the population density at time zero and $r$ refers to the intrinsic rate of natural increase.
0 likes
View Solution185
EasyMCQ
If in a population of size $N$,the birth rates are represented as $b$ and death rates as $d$,then the increase or decrease in $N$ during a unit time period $t$ will be:
A
$\frac{dN}{dt} = (b - d) \times N$
B
$\frac{dN}{dt} = (d - b) \times N$
C
$\frac{dN}{dt} = (b - N) \times d$
D
$\frac{dN}{dt} = (N - d) \times b$
Solution
(A) In population ecology,the change in population size $N$ over a unit time period $t$ is determined by the difference between the birth rate $(b)$ and the death rate $(d)$.
This is expressed by the equation: $\frac{dN}{dt} = (b - d) \times N$.
Here,$(b - d)$ represents the intrinsic rate of natural increase $(r)$.
If $b > d$,the population increases; if $d > b$,the population decreases.
This is expressed by the equation: $\frac{dN}{dt} = (b - d) \times N$.
Here,$(b - d)$ represents the intrinsic rate of natural increase $(r)$.
If $b > d$,the population increases; if $d > b$,the population decreases.
0 likes
View Solution186
EasyMCQ
For the Verhulst-Pearl Logistic Growth equation $dN/dt = rN \left(\frac{K-N}{K}\right)$,what does $K$ indicate?
A
Carrying capacity
B
Intrinsic rate of natural increase
C
Population density
D
Probability constant
Solution
(A) In the Verhulst-Pearl Logistic Growth equation,$dN/dt = rN \left(\frac{K-N}{K}\right)$:
$1$. $N$ represents the population density at time $t$.
$2$. $r$ represents the intrinsic rate of natural increase.
$3$. $K$ represents the carrying capacity,which is the maximum population size that an environment can sustain given the available resources.
Therefore,the correct option is $A$.
$1$. $N$ represents the population density at time $t$.
$2$. $r$ represents the intrinsic rate of natural increase.
$3$. $K$ represents the carrying capacity,which is the maximum population size that an environment can sustain given the available resources.
Therefore,the correct option is $A$.
0 likes
View Solution187
EasyMCQ
Which of the following is the formula for the logistic growth curve?
A
$\frac{dN}{dt} = rN \left( \frac{K-N}{K} \right)$
B
$\frac{dN}{dt} = rN$
C
$N_t = N_0 e^{rt}$
D
$\frac{dN}{dt} = N \left( \frac{K-N}{K} \right)$
Solution
(A) The logistic growth model describes population growth when resources are limited.
In this model,the population growth rate $\frac{dN}{dt}$ is proportional to the population size $N$ and the fraction of the carrying capacity $K$ that is still available,represented by $\left( \frac{K-N}{K} \right)$.
Therefore,the correct formula is $\frac{dN}{dt} = rN \left( \frac{K-N}{K} \right)$,where $r$ is the intrinsic rate of natural increase.
Option $A$ represents this correct mathematical expression.
0 likes
View Solution188
EasyMCQ
Which of the following is the correct equation for Verhulst-Pearl logistic growth?
A
$dN/dt = rN$
B
$N_t = N_0 e^{rt}$
C
$dN/dt = rN((K - N)/K)$
D
$dN/dt = rN(K / (K - N))$
Solution
(C) The Verhulst-Pearl logistic growth model describes population growth in an environment with limited resources. The equation is given by $dN/dt = rN((K - N)/K)$,where $dN/dt$ is the rate of change in population size,$r$ is the intrinsic rate of natural increase,$N$ is the population density at time $t$,and $K$ is the carrying capacity of the environment.
0 likes
View Solution189
EasyMCQ
'India is a country of pre-reproductive aged people.' On the basis of this statement,what is the representation of age pyramids for Indians?
A
Declining
B
Stable
C
Irregular
D
Expanding
Solution
(D) An age pyramid represents the distribution of various age groups in a population.
When a population has a high proportion of individuals in the pre-reproductive age group,the base of the age pyramid is very broad.
This broad base indicates that the population is growing rapidly,as these individuals will soon enter the reproductive age.
Such a pyramid is referred to as an 'Expanding' or 'Triangular' age pyramid.
Since India has a large young population,its age pyramid is expanding.
0 likes
View Solution190
EasyMCQ
If the population at time $t$ is $N_t$,then its population at time $t + 1$ is . . . . . . .
A
$N_{t+1} = N_t - [(B + I) - (D + E)]$
B
$N_{t+1} = N_t + [(B + I) - (D + E)]$
C
$N_{t+1} = N_t + [(B - I) + (D + E)]$
D
$N_{t+1} = N_t + [(B + I) - (D - E)]$
Solution
(B) The population density at time $t+1$ is calculated by considering the initial population at time $t$ and adding the net changes due to births $(B)$,immigration $(I)$,deaths $(D)$,and emigration $(E)$.
The formula is given by: $N_{t+1} = N_t + [(B + I) - (D + E)]$.
Here,$(B + I)$ represents the total number of individuals added to the population,and $(D + E)$ represents the total number of individuals lost from the population. Therefore,the correct option is $B$.
The formula is given by: $N_{t+1} = N_t + [(B + I) - (D + E)]$.
Here,$(B + I)$ represents the total number of individuals added to the population,and $(D + E)$ represents the total number of individuals lost from the population. Therefore,the correct option is $B$.
0 likes
View Solution191
EasyMCQ
When the reactions are not growth limiting,the growth curve is . . . . . . .
A
$J$-shaped
B
$S$-shaped
C
$L$-shaped
D
$K$-shaped
Solution
(A) When resources are unlimited and there are no environmental resistance factors (growth-limiting factors),the population grows exponentially. This type of growth is represented by a $J$-shaped curve. In contrast,an $S$-shaped (sigmoid) curve represents logistic growth,which occurs when resources are limited and environmental resistance is present.
0 likes
View Solution192
EasyMCQ
In the following equation of Verhulst-Pearl logistic growth,the letter '$r$' denotes . . . . . .
$\frac{ dN }{ dt }= rN \left[\frac{ K - N }{ K }\right]$
$\frac{ dN }{ dt }= rN \left[\frac{ K - N }{ K }\right]$
A
Population density
B
Extrinsic rate of natural increase
C
Intrinsic rate of natural increase
D
Carrying capacity
Solution
(C) The correct option is $C$.
In the Verhulst-Pearl logistic growth equation,$\frac{ dN }{ dt }= rN \left[\frac{ K - N }{ K }\right]$,the variables are defined as follows:
$N$ represents the population density at time $t$.
$r$ represents the intrinsic rate of natural increase.
$K$ represents the carrying capacity of the environment.
Therefore,the letter '$r$' denotes the intrinsic rate of natural increase.
0 likes
View Solution193
EasyMCQ
Verhulst-Pearl logistic growth is described by the equation $\frac{dN}{dt} = rN \left[\frac{K - N}{K}\right]$,where '$r$' and '$K$' represent:
A
$r$-intrinsic rate of natural decrease,$K$-carrying capacity
B
$r$-intrinsic rate of natural increase,$K$-carrying capacity
C
$r$-extrinsic rate of natural increase,$K$-productive capacity
D
$r$-extrinsic rate of natural decrease,$K$-carrying capacity
Solution
(B) The correct option is $B$.
The Verhulst-Pearl logistic growth model is represented by the differential equation:
$\frac{dN}{dt} = rN \left[\frac{K - N}{K}\right]$
In this equation:
$1$. $r$ stands for the intrinsic rate of natural increase,which represents the biotic potential of a population.
$2$. $N$ represents the population density at time $t$.
$3$. $K$ stands for the carrying capacity,which is the maximum population size that an environment can sustain given the available resources.
0 likes
View Solution194
DifficultMCQ
In a forest,there are initially $100$ deer. Over a certain period,$30$ are born and $10$ die. Assuming food is abundant and predators are few,calculate the intrinsic rate of natural increase for that population.
A
$0.015$
B
$0.2$
C
$0.18$
D
$0.4$
Solution
(B) The initial population size $(N)$ is $100$.
Number of births $(B)$ is $30$.
Number of deaths $(D)$ is $10$.
The net increase in population is calculated as $B - D = 30 - 10 = 20$.
The intrinsic rate of natural increase $(r)$ is calculated by dividing the net increase by the initial population size.
$r = \frac{20}{100} = 0.2$.
Therefore,the intrinsic rate of natural increase for the population is $0.2$.
0 likes
View Solution195
MediumMCQ
Which of the following equations depicts Verhulst-Pearl logistic population growth?
A
$\frac{dN}{dt} = rN \left( \frac{K-N}{K} \right)$
B
$\frac{dN}{dt} = rN \left( \frac{K}{K-N} \right)$
C
$\frac{dN}{dt} = rN \left( \frac{K-N}{N} \right)$
D
$\frac{dN}{dt} = rN \left( \frac{K+N}{K} \right)$
Solution
(A) The Verhulst-Pearl logistic growth equation describes population growth limited by environmental resources,represented by the carrying capacity $(K)$.
The equation is given by $\frac{dN}{dt} = rN \left( \frac{K-N}{K} \right)$.
Here,$N$ represents the population size at time $t$,$r$ is the intrinsic rate of natural increase,and $K$ is the carrying capacity of the environment.
The equation is given by $\frac{dN}{dt} = rN \left( \frac{K-N}{K} \right)$.
Here,$N$ represents the population size at time $t$,$r$ is the intrinsic rate of natural increase,and $K$ is the carrying capacity of the environment.
0 likes
View SolutionOrganisms and Populations — Population Growth · Frequently Asked Questions
1Are these Organisms and Populations questions useful for JEE and NEET?
Yes. All questions in this section are mapped to JEE Main and NEET exam patterns. Previous year questions from JEE Main, NEET, GUJCET and state-level exams are included with full solutions.
2Can I switch to Hindi or Gujarati for these questions?
Yes. Use the language tabs in the hero section or the sidebar to view the same questions and solutions in English, Hindi or Gujarati.
3How do I generate a question paper from this subtopic?
Use the Vedclass Exam Paper Generator — select the chapter and subtopic, set difficulty, and generate Sets A, B, C, D automatically. First 3 chapters of every subject are free.
Vedclass Products
For Students
Vedclass Test Series
Mock tests in real JEE/NEET style with performance analysis. 5-day free trial.
Start Free TrialFor Teachers
Exam Paper Generator
Generate Set A/B/C/D papers from this chapter in 2 minutes. 3 chapters free.
Try FreeFor Institutes
Online Exam Module
Live online exams with unlimited students, 360° analytics & white-label branding.
See DemoFor Teachers & Institutes
Generate a Organisms and Populations Exam Paper in 2 Minutes
Select subtopic & difficulty — Sets A, B, C, D auto-generated with No Repeat logic.
First 3 chapters of every subject are free — no payment required.