
A English
Population Growth Questions in English
Class 12 Biology · Organisms and Populations · Population Growth
195+
Questions
English
Language
100%
With Solutions
Showing 49 of 195 questions in English
51
EasyMCQ
In India,the human population has a large number of young individuals. This is because of:
A
Long lifespan and low birth rate
B
Short lifespan and high birth rate
C
Short lifespan and low birth rate
D
Equal birth rate and death rate
Solution
(B) The age structure of a population is represented by an age pyramid. In India,the population pyramid shows a broad base,which indicates a large number of young individuals.
This demographic profile is primarily due to a high birth rate,which adds more individuals to the younger age groups,and a relatively shorter average lifespan compared to developed nations,which keeps the proportion of older individuals lower.
This demographic profile is primarily due to a high birth rate,which adds more individuals to the younger age groups,and a relatively shorter average lifespan compared to developed nations,which keeps the proportion of older individuals lower.
0 likes
View Solution52
MediumMCQ
What is the term for the maximum population size of a species that an environment can sustain indefinitely,given the available resources?
A
Growth capacity
B
Population capacity
C
Carrying capacity
D
Mortality rate
Solution
(C) The maximum population size of a species that an environment can sustain indefinitely,given the available resources like food,habitat,water,and other necessities,is known as the $Carrying \ capacity$ $(K)$.
In a logistic growth model,the population growth rate slows down as it approaches the $Carrying \ capacity$ of the environment,resulting in an $S$-shaped or $Sigmoid$ growth curve.
In a logistic growth model,the population growth rate slows down as it approaches the $Carrying \ capacity$ of the environment,resulting in an $S$-shaped or $Sigmoid$ growth curve.
0 likes
View Solution53
EasyMCQ
What is the primary factor for population growth?
A
Early marriage
B
Suitable and favorable environment
C
High reproductive capacity
D
High birth rate and low death rate
Solution
(D) Population growth is primarily determined by the balance between birth rates and death rates.
When the birth rate $(B)$ exceeds the death rate $(D)$,the population size increases.
Mathematically,the change in population density $(N)$ over time $(t)$ is given by $dN/dt = (B - D)N$.
Therefore,a high birth rate combined with a low death rate is the fundamental driver of rapid population growth.
0 likes
View Solution54
MediumMCQ
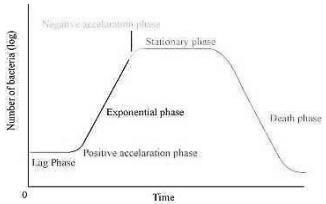
$A$ bacterial population grows at a constant rate per minute. If the logarithm of the population size is plotted against time, what is the shape of the graph?
A
Sigmoid
B
Hyperbolic
C
$A$ straight line with a positive slope
D
$A$ straight line with a negative slope
Solution
(C) The growth of a bacterial population under ideal conditions follows an exponential growth model, represented by the equation $N_t = N_0 e^{rt}$.
Taking the natural logarithm on both sides, we get $ln(N_t) = ln(N_0) + rt$.
This equation is in the form of a linear equation $y = mx + c$, where $y = ln(N_t)$, $x = t$ (time), $m = r$ (growth rate), and $c = ln(N_0)$.
Since the growth rate $r$ is positive, the graph of $ln(N_t)$ versus time $t$ results in a straight line with a positive slope.
0 likes
View Solution55
EasyMCQ
What is the zero growth phase?
A
No immigration
B
No emigration
C
No new births
D
Equal number of births and deaths
Solution
(D) The zero growth phase,also known as a stable population,occurs when the birth rate is exactly equal to the death rate. In this state,the population size remains constant over time because the number of individuals added to the population through births is balanced by the number of individuals lost through deaths. Mathematically,this is represented as $r = 0$ (where $r$ is the intrinsic rate of natural increase).
0 likes
View Solution56
EasyMCQ
In which phase is the human population after the $17^{th}$ century?
A
Zero growth phase
B
Exponential growth phase
C
Sigmoid phase
D
Stationary phase
Solution
(B) After the $17^{th}$ century,the human population has been experiencing rapid growth due to advancements in medicine,agriculture,and technology.
This rapid increase in population size,where the birth rate significantly exceeds the death rate,is characteristic of the $Exponential$ $growth$ $phase$ (also known as the $J$-shaped curve).
Therefore,the human population is currently in the exponential growth phase.
This rapid increase in population size,where the birth rate significantly exceeds the death rate,is characteristic of the $Exponential$ $growth$ $phase$ (also known as the $J$-shaped curve).
Therefore,the human population is currently in the exponential growth phase.
0 likes
View Solution57
EasyMCQ
In which phase is the maximum growth rate observed?
A
Senescent phase
B
Lag phase
C
Exponential phase
D
Stationary phase
Solution
(C) The growth curve of a population typically follows a sigmoid pattern consisting of four phases:
$1$. $Lag$ phase: Initial phase where growth is slow as organisms adapt to the environment.
$2$. $Exponential$ (or $Log$) phase: The phase where the population grows at its maximum rate because resources are abundant.
$3$. $Stationary$ phase: Growth slows down and levels off as resources become limited.
$4$. $Senescent$ phase: Population decline due to environmental resistance or resource exhaustion.
Therefore,the maximum growth rate is observed in the $Exponential$ phase.
0 likes
View Solution58
MediumMCQ
In which of the following is exponential growth observed?
A
Unicellular organisms
B
Tissue culture cells
C
Embryos
D
Multicellular plants
Solution
(A) Exponential growth occurs when resources are unlimited,allowing a population to grow at its maximum biotic potential.
In nature,this is rarely sustained for long periods.
However,it is observed in specific scenarios such as:
$1$. Unicellular organisms (like bacteria) when placed in a fresh culture medium with abundant nutrients.
$2$. Tissue culture cells under controlled laboratory conditions.
$3$. Populations introduced into a new environment with no predators or competition.
Since both $A$ and $B$ represent scenarios where exponential growth is typically studied or observed,and given the standard context of population ecology questions,$A$ is the most fundamental biological example of exponential growth.
0 likes
View Solution59
MediumMCQ
If a population of a species is transported to a more favorable environment,it will show:
A
Protection against enemies
B
Higher survival of organisms
C
Increased reproductive rate
D
Unlimited food supply
Solution
(B) When a population of a species is moved to a more favorable environment,the environmental resistance decreases.
This leads to better survival conditions for the individuals.
As a result,more organisms survive to reach reproductive age,leading to an increased survival rate and population growth.
This leads to better survival conditions for the individuals.
As a result,more organisms survive to reach reproductive age,leading to an increased survival rate and population growth.
0 likes
View Solution60
MediumMCQ
The term for the maximum population growth under ideal conditions is .........
A
Biotic potential
B
Secondary productivity
C
Carrying capacity
D
Biomass
Solution
(A) Biotic potential is defined as the maximum reproductive capacity of an organism or population under ideal environmental conditions,where resources are unlimited and there are no environmental resistances (such as predation,disease,or competition).
Therefore,the correct term is Biotic potential.
Therefore,the correct term is Biotic potential.
0 likes
View Solution61
EasyMCQ
The unrestricted reproductive capacity in a population is called ........
A
Biotic potential
B
Fecundity
C
Carrying capacity
D
Natality
Solution
(A) Biotic potential is defined as the maximum reproductive capacity of an organism under optimal environmental conditions,where resources are unlimited and there is no environmental resistance.
It represents the inherent ability of a population to increase in number when conditions are ideal.
It represents the inherent ability of a population to increase in number when conditions are ideal.
0 likes
View Solution62
EasyMCQ
The study of human population growth is known as:
A
Anthropology
B
Sociology
C
Demography
D
Geography
Solution
(C) Demography is the statistical study of human populations. It encompasses the study of the size,structure,and distribution of these populations,and spatial or temporal changes in them in response to birth,migration,aging,and death.
0 likes
View Solution63
MediumMCQ
Asymptote in a logistic growth curve is obtained when
A
$K = N$
B
$K > N$
C
$K < N$
D
the value of $r$ approaches zero.
Solution
(A) The logistic growth curve is represented by the equation $\frac{dN}{dt} = rN \left( \frac{K-N}{K} \right)$.
When the population density $(N)$ reaches the carrying capacity $(K)$,the term $\left( \frac{K-N}{K} \right)$ becomes zero.
Consequently,the growth rate $\frac{dN}{dt}$ becomes zero,and the population size remains constant.
This results in the formation of an asymptote in the growth curve,which occurs when $N = K$.
0 likes
View Solution64
MediumMCQ
Which of the following is correct for $r$-selected species?
A
Large number of progeny with small size
B
Large number of progeny with large size
C
Small number of progeny with small size
D
Small number of progeny with large size
Solution
(A) $r$-selected species ($r$-strategists) are organisms that can colonize a habitat rapidly by utilizing available resources before competitors arrive.
These organisms typically have short life spans and small body sizes (e.g.,bacteria,many insects).
Their survival strategy relies on producing a large number of offspring to ensure that at least some survive in unstable or temporary environments,rather than investing energy in competitive ability or parental care.
0 likes
View Solution65
MediumMCQ
When does the growth rate of a population following the logistic model equal zero? The logistic model is given as $dN/dt = rN(1 - N/K)$.
A
when $N/K$ equals zero
B
when death rate is greater than birth rate
C
when $N/K$ is exactly one
D
when $N$ nears the carrying capacity of the habitat.
Solution
(C) The logistic growth model is represented by the equation $dN/dt = rN(1 - N/K)$.
Here,$dN/dt$ represents the population growth rate.
For the growth rate to be zero,$dN/dt = 0$.
Substituting this into the equation: $0 = rN(1 - N/K)$.
Since $r$ (intrinsic rate of natural increase) and $N$ (population size) are generally non-zero in an active population,the term $(1 - N/K)$ must be equal to zero.
This implies $1 - N/K = 0$,which simplifies to $N/K = 1$.
Therefore,the population growth rate becomes zero when the population size $N$ reaches the carrying capacity $K$ (i.e.,$N/K = 1$).
0 likes
View Solution66
MediumMCQ
The logistic population growth is expressed by the equation:
A
$dt / dN = Nr (\frac{K-N}{K})$
B
$dN / dt = rN (\frac{K-N}{K})$
C
$dN / dt = rN$
D
$dN / dt = rN (\frac{N-K}{N})$
Solution
(B) The correct option is $B$.
Logistic population growth is expressed by the following equation:
$dN / dt = rN (\frac{K-N}{K})$
Where:
$N$ = Population density at time $t$
$r$ = Intrinsic rate of natural increase
$K$ = Carrying capacity
This model represents growth in an environment with limited resources,where the growth rate slows down as the population size approaches the carrying capacity $K$.
0 likes
View Solution67
MediumMCQ
The population of an insect species shows an explosive increase in numbers during the rainy season,followed by its disappearance at the end of the season. What does this show?
A
The food plants mature and die at the end of the rainy season.
B
Its population growth curve is of $J$-type.
C
The population of its predators increases enormously.
D
$S$-shaped or sigmoid growth of this insect.
Solution
(B) The correct answer is $(B)$.
$J$-shaped growth pattern is observed in populations where resources are abundant for a short period,leading to exponential growth,followed by a sudden crash due to environmental resistance or seasonal changes.
In this case,the insect population increases rapidly during the rainy season and disappears when the season ends,which is a characteristic feature of $J$-type growth curves.
This pattern is common in insects,algae blooms,and annual plants.
0 likes
View Solution68
MediumMCQ
Exponential population growth is represented by
A
$dN/dt = rN$
B
$dt/dN = rN$
C
$N/rN = dt$
D
$rN/dN = dt$
Solution
(A) Exponential growth occurs when resources are unlimited. The rate of change in population size $(N)$ over time $(t)$ is proportional to the current population size. The mathematical expression for exponential growth is given by the differential equation: $dN/dt = rN$,where $N$ is the population size,$t$ is time,and $r$ is the intrinsic rate of natural increase.
0 likes
View Solution69
MediumMCQ
What is the correct mathematical representation of the Verhulst-Pearl logistic growth equation?
A
$\frac{dN}{dt} = rN \left( 1 - \frac{N}{K} \right)$
B
$dN = rN - \frac{N}{K}$
C
$\frac{dN}{dt} = rN - \frac{N}{K}$
D
$\frac{dN}{dt} = rN - \frac{1}{K}$
Solution
(A) The Verhulst-Pearl logistic growth model describes population growth in an environment with limited resources.
In this model,the population growth rate $\frac{dN}{dt}$ is proportional to the current population size $N$ and the fraction of the carrying capacity $K$ that is still available,represented by $\left( 1 - \frac{N}{K} \right)$.
Therefore,the equation is given by $\frac{dN}{dt} = rN \left( 1 - \frac{N}{K} \right)$,where $r$ is the intrinsic rate of natural increase and $K$ is the carrying capacity.
0 likes
View Solution70
MediumMCQ
Which of the following characteristics is true for pelagic fishes?
A
Produce a small number of large-sized offspring.
B
Produce a large number of small-sized offspring.
C
Breed only once in their lifetime.
D
None of the above.
Solution
(B) Pelagic fishes are organisms that live in the water column of coastal,ocean,and lake waters. According to the life history variation theory in ecology,many species have evolved to maximize their fitness. Pelagic fishes typically follow an '$r$-selection' strategy. This strategy involves producing a large number of small-sized offspring with high mortality rates,which ensures that at least some survive to adulthood in an unpredictable environment.
0 likes
View Solution71
MediumMCQ
In a population,the number of pre-reproductive age organisms is more than the post-reproductive age organisms. As a result,the population will .....
A
Increase
B
Decrease
C
Stable
D
Can not say anything
Solution
(A) The age structure of a population is represented by an age pyramid.
If the number of individuals in the pre-reproductive age group is significantly higher than those in the post-reproductive age group,the population is considered to be in an expanding or growing phase.
This is because a large number of individuals will soon enter the reproductive age,leading to a higher birth rate compared to the death rate.
Therefore,the population size will increase over time.
0 likes
View Solution72
MediumMCQ
Verhulst-Pearl logistic growth is described by the equation:
A
$N_t = N_0 e^{rt}$
B
$\frac{dN}{dt} = rN \left( \frac{K-N}{K} \right)$
C
$\frac{dN}{dt} = rN$
D
$N_{t+1} = N_t + [(B+I) - (D+E)]$
Solution
(B) The Verhulst-Pearl logistic growth model describes population growth in an environment with limited resources.
In this model,the population growth rate $\frac{dN}{dt}$ is given by the equation $\frac{dN}{dt} = rN \left( \frac{K-N}{K} \right)$,where:
$N$ = Population density at time $t$,
$r$ = Intrinsic rate of natural increase,
$K$ = Carrying capacity.
This equation represents an $S$-shaped (sigmoid) growth curve,which is more realistic than the exponential growth model $(N_t = N_0 e^{rt})$ because it accounts for environmental resistance as the population approaches the carrying capacity $(K)$.
0 likes
View Solution73
MediumMCQ
The intrinsic rate of natural increase $(r)$ for the flour beetle is:
A
$0.015$
B
$0.0205$
C
$0.0022$
D
$0.12$
Solution
(D) The intrinsic rate of natural increase $(r)$ is a critical parameter for assessing impacts of any biotic or abiotic factor on population growth.
According to the $NCERT$ textbook,the value of $r$ for the flour beetle is $0.12$.
This value represents the per capita growth rate of the population under ideal environmental conditions.
According to the $NCERT$ textbook,the value of $r$ for the flour beetle is $0.12$.
This value represents the per capita growth rate of the population under ideal environmental conditions.
0 likes
View Solution74
MediumMCQ
If a population growing exponentially doubles in size in $3$ years,what is the intrinsic rate of increase $(r)$ of the population (in $\%$)? $(e = 2.71828)$
A
$23.1$
B
$92.4$
C
$69.3$
D
$41.2$
Solution
(A) For exponential growth,the population size at time $t$ is given by the formula $N_t = N_0 e^{rt}$.
Given that the population doubles in $3$ years,we have $N_t = 2N_0$ when $t = 3$.
Substituting these values into the equation: $2N_0 = N_0 e^{r \times 3}$.
Dividing both sides by $N_0$,we get $2 = e^{3r}$.
Taking the natural logarithm $(\ln)$ on both sides: $\ln(2) = 3r$.
We know that $\ln(2) \approx 0.693$.
So,$0.693 = 3r$.
Solving for $r$: $r = 0.693 / 3 = 0.231$.
To express this as a percentage: $0.231 \times 100 = 23.1\%$.
0 likes
View Solution75
MediumMCQ
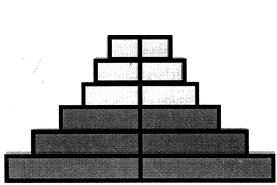
What does the given figure indicate?
A
Expanding population
B
Declining population
C
Stable population
D
None
Solution
(A) The given figure represents an age pyramid where the base (pre-reproductive age group) is very broad,indicating a high proportion of young individuals.
As we move up the pyramid,the width decreases,showing a smaller proportion of reproductive and post-reproductive individuals.
This type of pyramid is characteristic of an expanding population,where the birth rate is high and the population is growing rapidly.
Therefore,the correct option is $A$.
As we move up the pyramid,the width decreases,showing a smaller proportion of reproductive and post-reproductive individuals.
This type of pyramid is characteristic of an expanding population,where the birth rate is high and the population is growing rapidly.
Therefore,the correct option is $A$.
0 likes
View Solution76
MediumMCQ
In a population,if the number of post-reproductive age organisms is more than the reproductive age organisms,what will be the result for the population?
A
Increase
B
Decrease
C
Stable
D
None
Solution
(B) In population ecology,the age structure of a population is represented by an age pyramid.
If the number of post-reproductive individuals is higher than the reproductive individuals,it indicates a declining population.
This is because the number of individuals entering the reproductive phase is insufficient to replace the dying individuals,leading to a negative growth rate.
Therefore,the population will decrease.
0 likes
View Solution77
MediumMCQ
In India,the human population is heavily weighted towards the younger age group. This results in:
A
Short lifespan and low birth rate in many individuals.
B
Long lifespan and low birth rate in many individuals.
C
Short lifespan and high birth rate in many individuals.
D
Long lifespan and high birth rate in many individuals.
Solution
(D) population that is heavily weighted towards the younger age group is known as an expanding population.
In such a population,the number of individuals in the pre-reproductive and reproductive age groups is very high.
This demographic structure typically leads to a high birth rate because a large proportion of the population is entering or is currently in the reproductive phase.
Furthermore,improvements in healthcare and nutrition have contributed to a longer average lifespan for individuals in India compared to previous decades.
Therefore,the combination of a large youth population and better survival rates results in a high birth rate and a longer lifespan for many individuals.
0 likes
View Solution78
MediumMCQ
Human population growth in India is:
A
Following a sigmoid curve as in many other animal species.
B
Showing a zero growth rate as in some animal species.
C
Controlled by natural disasters and birth control measures.
D
Controlled by the adoption of national family planning programs.
Solution
(C) Human population growth in India is influenced by a combination of natural factors and deliberate human interventions.
Unlike many animal species that follow a natural $S$-shaped (sigmoid) growth curve,human population dynamics are significantly altered by technological,medical,and social advancements.
Natural disasters act as density-independent limiting factors,while birth control measures and national family planning programs are deliberate strategies to regulate population growth.
Therefore,option $C$ is the most accurate description of the factors controlling population growth in the Indian context.
0 likes
View Solution79
EasyMCQ
The statement 'Food supply increases in an arithmetic progression,while population tends to increase in a geometric progression' was proposed by:
A
Stuart Mill
B
Adam Smith
C
Charles Darwin
D
Thomas Malthus
Solution
(D) The concept that food supply increases in an arithmetic progression $(1, 2, 3, 4, ...)$ while human population tends to increase in a geometric progression $(1, 2, 4, 8, ...)$ was proposed by the economist Thomas Malthus in his work 'An Essay on the Principle of Population'. This theory highlights the potential for a population crisis when the growth of the population outpaces the growth of resources.
0 likes
View Solution80
EasyMCQ
Select the correct sequence of phases in the bacterial growth curve.
A
Lag phase,Log phase,Stationary phase,Decline phase
B
Lag phase,Log phase,Stationary phase
C
Stationary phase,Log phase,Decline phase
D
Decline phase,Lag phase,Log phase
Solution
(A) The bacterial growth curve typically consists of four distinct phases:
$1$. $Lag$ phase: $A$ period of adaptation where bacteria prepare for division.
$2$. $Log$ (or exponential) phase: $A$ period of rapid cell division and exponential growth.
$3$. $Stationary$ phase: $A$ period where the growth rate equals the death rate due to nutrient depletion and waste accumulation.
$4$. $Decline$ (or death) phase: $A$ period where the death rate exceeds the growth rate,leading to a decrease in the population.
0 likes
View Solution81
DifficultMCQ
When the number of bacteria growing per minute is plotted against time on a logarithmic scale,what shape does the graph take?
A
Sigmoid
B
Hyperbolic
C
Upward sloping straight line
D
Downward sloping straight line
Solution
(C) Bacteria undergo exponential growth under ideal conditions,where the population size $N$ at time $t$ is given by $N_t = N_0 e^{rt}$.
Taking the natural logarithm on both sides,we get $\ln(N_t) = \ln(N_0) + rt$.
This equation is in the form of a straight line $y = mx + c$,where $y = \ln(N_t)$,$x = t$,$m = r$ (growth rate),and $c = \ln(N_0)$.
Since the growth rate $r$ is positive,the graph of $\ln(N_t)$ versus time $t$ results in an upward sloping straight line.
0 likes
View Solution82
MediumMCQ
What is the formula for exponential population growth?
A
$dN / dt = rN$
B
$dN / rN = dt$
C
$rN / dN = dt$
D
$dt / dN = rN$
Solution
(A) In exponential growth,the population size increases at a rate proportional to the current population size.
The mathematical expression for this is given by the differential equation: $dN / dt = rN$,where:
$N$ = Population size
$t$ = Time
$r$ = Intrinsic rate of natural increase
$dN / dt$ = Rate of change in population size over time.
The mathematical expression for this is given by the differential equation: $dN / dt = rN$,where:
$N$ = Population size
$t$ = Time
$r$ = Intrinsic rate of natural increase
$dN / dt$ = Rate of change in population size over time.
0 likes
View Solution83
MediumMCQ
Members of a certain insect species show a massive increase in population during the rainy season,decrease in number as winter approaches,and disappear by the end of winter. What does this indicate?
A
The host plant matures and dies at the end of the monsoon season.
B
The population growth curve is of the $J$-type.
C
The number of their predators increases significantly.
D
The insects exhibit an $S$-shaped growth curve.
Solution
(A) The phenomenon described indicates that the population size of the insects is heavily dependent on the availability of their host plants.
In many insect species,the life cycle is synchronized with the phenology of the host plant.
During the rainy season,the host plants are abundant and provide necessary resources,leading to a rapid increase in the insect population.
As winter approaches,the host plants mature,senesce,and die,leading to a decline and eventual disappearance of the insect population.
This is a classic example of resource-limited population dynamics where the host plant acts as a limiting factor.
0 likes
View Solution84
MediumMCQ
Which of the following is true for $r$-selected species?
A
Small number of offspring with small size
B
Small number of offspring with large size
C
Large number of offspring with small size
D
Large number of offspring with large size
Solution
(C) $r$-selected species are organisms that have evolved to maximize their reproductive rate $(r)$.
These species typically inhabit unstable or unpredictable environments.
Key characteristics of $r$-selected species include:
$1$. They produce a large number of offspring to ensure that at least some survive in harsh conditions.
$2$. The offspring are generally small in size.
$3$. They provide little to no parental care.
$4$. They have a short lifespan and reach reproductive maturity quickly.
Therefore,the correct option is $C$.
0 likes
View Solution85
MediumMCQ
When will the population growth rate be equal to zero following the logistic model? The logistic model equation is given as: $dN/dt = rN(1 - N/K)$
A
When $N$ represents the carrying capacity of the habitat.
B
When $N/K = 0$
C
When the death rate is higher than the birth rate.
D
When $N/K = 1$
Solution
(D) The logistic growth model is represented by the equation: $dN/dt = rN(1 - N/K)$.
Here,$dN/dt$ represents the population growth rate.
For the growth rate to be zero,$dN/dt = 0$.
Substituting this into the equation: $0 = rN(1 - N/K)$.
Since $r$ (intrinsic rate of natural increase) and $N$ (population size) are generally non-zero in a living population,the term $(1 - N/K)$ must be equal to zero.
Therefore,$1 - N/K = 0$,which implies $N/K = 1$.
This condition occurs when the population size $N$ reaches the carrying capacity $K$ of the environment.
0 likes
View Solution86
MediumMCQ
An asymptote in a logistic growth curve is obtained when:
A
$r$ approaches zero.
B
$K = N$
C
$K > N$
D
$K < N$
Solution
(B) The logistic growth model is represented by the equation $\frac{dN}{dt} = rN \left( \frac{K-N}{K} \right)$.
In this equation,$N$ is the population density,$r$ is the intrinsic rate of natural increase,and $K$ is the carrying capacity.
When the population size $N$ reaches the carrying capacity $K$,the term $\left( \frac{K-N}{K} \right)$ becomes zero.
Consequently,$\frac{dN}{dt} = 0$,meaning the population growth rate becomes zero and the population size stabilizes.
This stabilization point on the graph,where the curve flattens out,is known as the asymptote,which occurs when $N = K$.
0 likes
View Solution87
MediumMCQ
In a growing population of a country,
A
Pre-reproductive individuals are more than the reproductive individuals.
B
Pre-reproductive individuals are less than reproductive individuals.
C
Reproductive individuals and pre-reproductive individuals are equal in number.
D
Reproductive individuals are less than the post-reproductive individuals.
Solution
(A) population is considered to be growing (expanding) when the number of pre-reproductive individuals is significantly higher than the number of reproductive and post-reproductive individuals.
This creates an age pyramid with a broad base,indicating a high birth rate and a large number of young individuals who will enter the reproductive age in the future.
Therefore,the correct condition for a growing population is that pre-reproductive individuals are more than the reproductive individuals.
0 likes
View Solution88
MediumMCQ
Carrying capacity is
A
the capacity of an individual to produce young ones
B
availability of resources in a given habitat to support a certain number of individuals of a population,beyond which no further growth is possible
C
gene frequency from one generation to next
D
gene frequency in the same generation
Solution
(B) Carrying capacity is defined as the maximum number of individuals of a population that can be supported by the available resources in a given habitat.
Beyond this limit,the environment cannot sustain additional individuals,and therefore,no further population growth is possible.
When a population reaches its carrying capacity,the resources become limited,often leading to a state where mortality exceeds or equals natality,preventing further increase.
0 likes
View Solution89
MediumMCQ
The formula for exponential population growth is
A
$dN/rN = dt$
B
$rN / dN = dt$
C
$dN / dt = rN$
D
$dt / dN = rN$
Solution
(C) The formula for exponential population growth is $\frac{dN}{dt} = rN$.
Here,$\frac{dN}{dt}$ represents the rate of change in population size over time.
$r$ represents the intrinsic rate of natural increase (biotic potential).
$N$ represents the current population size.
Here,$\frac{dN}{dt}$ represents the rate of change in population size over time.
$r$ represents the intrinsic rate of natural increase (biotic potential).
$N$ represents the current population size.
0 likes
View Solution90
MediumMCQ
$A$ population of $500$ experiences $55$ births and $5$ deaths during a one-year period. What is the reproductive rate for the population during the one-year period?
A
$0.01/ \text{year}$
B
$0.05/ \text{year}$
C
$0.1/ \text{year}$
D
$50/ \text{year}$
Solution
(C) The reproductive rate (or per capita growth rate) is calculated by the formula: $\text{Rate} = \frac{\text{Births} - \text{Deaths}}{\text{Initial Population}}$.
Given: $\text{Births} = 55$, $\text{Deaths} = 5$, $\text{Initial Population} = 500$.
$\text{Rate} = \frac{55 - 5}{500} = \frac{50}{500} = 0.1/ \text{year}$.
Given: $\text{Births} = 55$, $\text{Deaths} = 5$, $\text{Initial Population} = 500$.
$\text{Rate} = \frac{55 - 5}{500} = \frac{50}{500} = 0.1/ \text{year}$.
0 likes
View Solution91
MediumMCQ
Assertion: In a sigmoid growth curve,the population finally stabilizes itself.
Reason: Finally,the death rate increases more than the birth rate.
Reason: Finally,the death rate increases more than the birth rate.
A
If both Assertion and Reason are correct and the Reason is a correct explanation of the Assertion.
B
If both Assertion and Reason are correct but Reason is not a correct explanation of the Assertion.
C
If the Assertion is correct but Reason is incorrect.
D
If both the Assertion and Reason are incorrect.
Solution
(C) In a sigmoid growth curve,the population growth rate eventually becomes stable as the population reaches the carrying capacity $(K)$ of the environment.
At this stage,the mortality rate (death rate) and natality rate (birth rate) become equal to each other.
Consequently,the population shows a zero growth rate because the birth rate equals the death rate,not because the death rate exceeds the birth rate.
Therefore,the Assertion is correct,but the Reason is incorrect.
0 likes
View Solution92
DifficultMCQ
If a population growing exponentially doubles in size in $3$ years,what is the intrinsic rate of increase $(r)$ of the population?
A
$0.2311$
B
$0.3311$
C
$0.1311$
D
$0.4311$
Solution
(A) population grows exponentially if sufficient amounts of food resources are available to the individuals. Its exponential growth can be calculated by the following integral form of the exponential growth equation:
$N_{t} = N_{0} e^{rt}$
Where,
$N_{t} =$ Population density after time $t$
$N_{0} =$ Population density at time zero
$r =$ Intrinsic rate of natural increase
$e =$ Base of natural logarithms $(2.71828)$
Given that the population doubles in $3$ years:
$N_{t} = 2N_{0}$
$t = 3$ years
Substituting these values into the equation:
$2N_{0} = N_{0} e^{3r}$
$2 = e^{3r}$
Taking the natural logarithm $(\ln)$ on both sides:
$\ln(2) = 3r$
$r = \frac{\ln(2)}{3}$
Using the value $\ln(2) \approx 0.693$:
$r = \frac{0.693}{3} = 0.231$
Thus,the intrinsic rate of increase $(r)$ is approximately $0.231$.
0 likes
View Solution93
Medium
With the help of a suitable diagram,describe the logistic population growth curve.
Solution
(N/A) The logistic population growth curve is commonly observed in populations where resources are limited. It is represented by an $S-$shaped curve,also known as the Verhulst-Pearl logistic growth curve. It typically includes the following phases:
$1$. Lag phase: Initially,the population growth is slow as the organisms adapt to the new environment.
$2$. Log (Exponential) phase: The population grows rapidly due to the availability of sufficient resources.
$3$. Negative acceleration phase: As resources become limited,environmental resistance increases,and the growth rate begins to slow down.
$4$. Stationary phase: The population size stabilizes when the birth rate equals the death rate. At this point,the population has reached the carrying capacity $(K)$ of the habitat.
0 likes
View Solution94
Easy
Explain exponential growth as a growth model with a suitable graph and examples.
Solution
(N/A) For the unimpeded growth of a population,the availability of resources (food and space) is essential. Ideally,when resources in the habitat are unlimited,each species has the ability to realize fully its innate potential to grow in number,as Darwin observed while developing his theory of natural selection. In such conditions,the population grows in an exponential or geometric fashion.
If in a population of size $N$,the birth rates (not total number but per capita births) are represented as $b$ and death rates (per capita deaths) as $d$,then the increase or decrease in $N$ during a unit time period $t$ $(dN/dt)$ will be:
$dN/dt = (b - d) \times N$
Let $(b - d) = r$,then:
$dN/dt = rN$
The $r$ in this equation is called the 'intrinsic rate of natural increase' and is a very important parameter chosen for assessing impacts of any biotic or abiotic factor on population growth.
To give you some idea about the magnitude of $r$ values,for the Norway rat,the $r$ is $0.015$,and for the flour beetle,it is $0.12$. In $1981$,the $r$ value for the human population in India was $0.0205$.
0 likes
View Solution95
EasyMCQ
State the popular humorous anecdote about the dramatic demonstration of how a large population can build up exponentially.
A
The story of a king and a minister playing chess.
B
The story of a farmer and his wheat field.
C
The story of a scientist and his bacterial culture.
D
The story of a king and his gold coins.
Solution
(A) The king and the minister sat down to play a game of chess. The king,confident in his victory,agreed to any bet proposed by the minister. The minister humbly requested that if he won,he would only want a few grains of wheat,the quantity of which would be calculated by placing one grain on the first square of the chessboard,two on the second,four on the third,eight on the fourth,and so on,doubling the amount for each subsequent square until all $64$ squares were filled.
The king accepted this seemingly silly bet and started the game,but unfortunately for him,the minister won. The king thought it would be very easy to fulfill the minister's bet. He started by placing one grain on the first square and continued filling the subsequent squares according to the minister's method. However,by the time half of the squares on the chessboard were filled,the king realized with dismay that even if all the wheat produced in his entire kingdom were gathered,it would be insufficient to fill all $64$ squares.
Now,consider a small $Paramoecium$ that starts with a single individual and doubles its number every day through binary fission. Imagine that in $64$ days,its population size would become mind-boggling (provided unlimited food and space are available).
0 likes
View Solution96
Easy
Explain logistic growth.
Solution
(N/A) In nature, no population has unlimited resources to permit exponential growth. This leads to competition between individuals for limited resources. Eventually, the 'fittest' individual will survive and reproduce. Many governments have realized this and introduced various restraints to limit human population growth.
In nature, a given habitat has enough resources to support a maximum possible number, beyond which no further growth is possible. Let us call this limit as nature's carrying capacity $(K)$ for that species in that habitat.
A population growing in a habitat with limited resources shows initially a lag phase, followed by phases of acceleration and deceleration and finally an asymptote, when the population density reaches the carrying capacity. A plot of $N$ in relation to time $(t)$ results in a sigmoid curve. This type of population growth is called Verhulst-Pearl Logistic Growth and is described by the following equation:
$dN/dt = rN \left( \frac{K - N}{K} \right)$
Where:
$N = \text{Population density at time } t$
$r = \text{Intrinsic rate of natural increase}$
$K = \text{Carrying capacity}$
Since resources for growth for most animal populations are finite and become limiting sooner or later, the logistic growth model is considered a more realistic model.
0 likes
View Solution97
EasyMCQ
What would be the growth rate pattern when the resources are unlimited?
A
Logistic growth
B
Exponential growth
C
Zero growth
D
Negative growth
Solution
(B) When resources are unlimited,each species has the ability to realize fully its innate potential to grow in number. In such conditions,the population grows in an exponential or geometric fashion. This is represented by the equation $dN/dt = rN$,where $r$ is the intrinsic rate of natural increase.
0 likes
View Solution98
Easy
Comment on the growth curve given below.
.jpg)
Solution
(N/A) The given graph represents the Logistic Growth Curve.
$1$. $A$ population growing in a habitat with limited resources initially shows a lag phase,followed by phases of acceleration and deceleration,and finally an asymptote when the population density reaches the carrying capacity $(K)$.
$2$. $A$ plot of population density $(N)$ in relation to time $(t)$ results in a sigmoid curve.
$3$. Here,$r$ is the intrinsic rate of natural increase,and $K$ is the carrying capacity of the environment.
$4$. This type of population growth is called the Verhulst-Pearl Logistic Growth and is described by the equation:
$\frac{dN}{dt} = rN \left( \frac{K-N}{K} \right)$
$5$. The term $\left( \frac{K-N}{K} \right)$ represents environmental resistance.
0 likes
View Solution99
MediumMCQ
$A$ population of $Paramecium$ $caudatum$ was grown in a culture medium. After $5$ days,the culture medium became overcrowded with $Paramecium$ and had depleted nutrients. What will happen to the population,and what type of growth curve will the population attain? Describe the growth curve.
A
The population will increase exponentially; $J$-shaped curve.
B
The population will stabilize at carrying capacity; $S$-shaped (Sigmoid) curve.
C
The population will go extinct immediately; No curve.
D
The population will fluctuate indefinitely; Linear curve.
Solution
(B) When a population is grown in a limited environment (like a culture medium),resources become limited as the population density increases.
Initially,the population shows a lag phase and then an exponential growth phase.
However,as nutrients are depleted and space becomes limited,the growth rate slows down and eventually reaches a plateau known as the carrying capacity $(K)$.
This type of growth is known as Logistic Growth,which is represented by an $S$-shaped or Sigmoid growth curve.
Therefore,the population will stabilize at the carrying capacity,and the growth curve will be Sigmoid.
0 likes
View SolutionOrganisms and Populations — Population Growth · Frequently Asked Questions
1Are these Organisms and Populations questions useful for JEE and NEET?
Yes. All questions in this section are mapped to JEE Main and NEET exam patterns. Previous year questions from JEE Main, NEET, GUJCET and state-level exams are included with full solutions.
2Can I switch to Hindi or Gujarati for these questions?
Yes. Use the language tabs in the hero section or the sidebar to view the same questions and solutions in English, Hindi or Gujarati.
3How do I generate a question paper from this subtopic?
Use the Vedclass Exam Paper Generator — select the chapter and subtopic, set difficulty, and generate Sets A, B, C, D automatically. First 3 chapters of every subject are free.
Vedclass Products
For Students
Vedclass Test Series
Mock tests in real JEE/NEET style with performance analysis. 5-day free trial.
Start Free TrialFor Teachers
Exam Paper Generator
Generate Set A/B/C/D papers from this chapter in 2 minutes. 3 chapters free.
Try FreeFor Institutes
Online Exam Module
Live online exams with unlimited students, 360° analytics & white-label branding.
See DemoFor Teachers & Institutes
Generate a Organisms and Populations Exam Paper in 2 Minutes
Select subtopic & difficulty — Sets A, B, C, D auto-generated with No Repeat logic.
First 3 chapters of every subject are free — no payment required.