
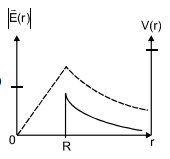
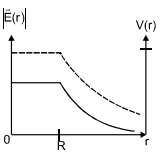
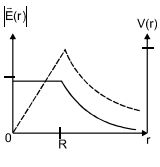
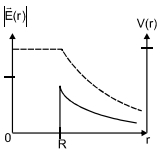
Consider a thin spherical shell of radius $R$ with its centre at the origin,carrying uniform positive surface charge density. The variation of the magnitude of the electric field $|\vec{E}(r)|$ and the electric potential $V(r)$ with the distance $r$ from the centre,is best represented by which graph?
- A
- B
- C
- D
Explore More
Similar Questions
Consider a uniform spherical volume charge distribution of radius $R$. Which of the following graphs correctly represents the magnitude of the electric field $E$ at a distance $r$ from the centre of the sphere?
MediumKVPY 2010
View SolutionThis question has Statement-$1$ and Statement-$2$. Of the four choices given after the statements,choose the one that best describes the two statements.
An insulating solid sphere of radius $R$ has a uniformly positive charge density $\rho$. As a result of this uniform charge distribution,there is a finite value of electric potential at the centre of the sphere,at the surface of the sphere,and also at a point outside the sphere. The electric potential at infinity is zero.
Statement-$1$: When a charge $q$ is taken from the centre to the surface of the sphere,its potential energy changes by $\frac{q \rho R^2}{6 \epsilon_0}$.
Statement-$2$: The electric field at a distance $r (r < R)$ from the centre of the sphere is $\frac{\rho r}{3 \epsilon_0}$.
DifficultAIEEE 2012
View Solution$A$ cube of side $a$ is placed in an electric field $\vec{E} = E_0 x \hat{i}$. What is the total charge enclosed by the cube?
Difficult
View SolutionTwo concentric conducting thin spherical shells $A$ and $B$ having radii $r_A$ and $r_B$ $(r_B > r_A)$ are charged to $Q_A$ and $-Q_B$ $(|Q_B| > |Q_A|)$. The electric field along a line passing through the centre is:
DifficultAIIMS 2005
View SolutionThere is a solid sphere of radius $R$ having uniformly distributed charge throughout it. What is the relation between electric field $E$ and distance $r$ from the centre (where $r < R$)?
Easy
View SolutionVedclass Products
For Students
Vedclass Test Series
Mock tests in real JEE/NEET style with performance analysis. 5-day free trial.
Start Free TrialFor Teachers
Exam Paper Generator
Generate Set A/B/C/D exam papers from 7.5L+ questions in 2 minutes. 3 chapters free.
Try FreeFor Institutes
Online Exam Module
Live online exams with unlimited students, 360° analytics & white-label branding.
See Demo