
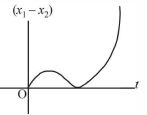
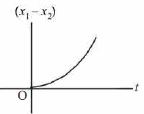
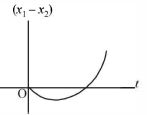
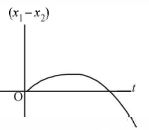
$A$ body is at rest at $x=0$. At $t=0$,it starts moving in the positive $x-$direction with a constant acceleration. At the same instant,another body passes through $x=0$ moving in the positive $x$ direction with a constant speed. The position of the first body is given by $x_{1}(t)$ after time $t$ and that of the second body by $x_{2}(t)$ after the same time interval. Which of the following graphs correctly describes $(x_{1}-x_{2})$ as a function of time $t$?
- A
- B
- C
- D
Explore More
Similar Questions
Two stones are thrown up vertically and simultaneously but with different speeds. Which graph correctly represents the time variation of their relative position $\Delta x$? Assume that stones do not bounce after hitting the ground.
Difficult
View SolutionMark the correct statements for a particle moving in a straight line.
Medium
View Solution$Assertion$: $A$ body with constant acceleration always moves along a straight line.
$Reason$: $A$ body with constant acceleration may not speed up.
$Reason$: $A$ body with constant acceleration may not speed up.
In what different ways can the velocity of an object be changed?
Medium
View SolutionWhen the velocity of a body is variable,then:
Easy
View SolutionVedclass Products
For Students
Vedclass Test Series
Mock tests in real JEE/NEET style with performance analysis. 5-day free trial.
Start Free TrialFor Teachers
Exam Paper Generator
Generate Set A/B/C/D exam papers from 7.5L+ questions in 2 minutes. 3 chapters free.
Try FreeFor Institutes
Online Exam Module
Live online exams with unlimited students, 360° analytics & white-label branding.
See Demo