
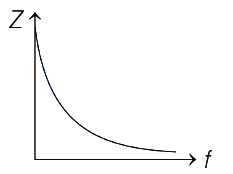
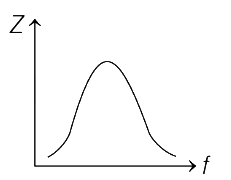
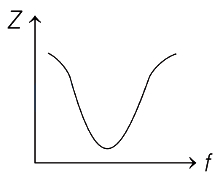
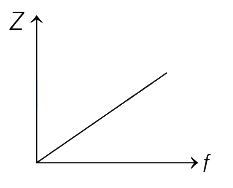
Which one of the following curves represents the variation of impedance $(Z)$ with frequency $(f)$ in a series $L-C-R$ circuit,when connected to an $AC$ source?
- A
- B
- C
- D
Explore More
Similar Questions
An inductor of inductance $L$ and a resistor of resistance $R$ are joined in series and connected to a source of frequency $\omega$. The power dissipated in the circuit is
Easy
View SolutionFor the given $RL$ circuit,the maximum power loss across the circuit can be $W$.
Medium
View Solution$A$ bulb and a capacitor are in series with an $ac$ source. On increasing the frequency,how will the glow of the bulb change?
Easy
View Solution$A$ $10\, V, 60\, W$ bulb is to be connected to a $100\, V, 50\, Hz$ $AC$ source. To operate the bulb at its rated power,an induction coil is connected in series with it. Calculate the required self-inductance of the coil.
Difficult
View SolutionWhen a coil is connected across a $20 \ V$ $DC$ supply,it draws a current of $5 \ A$. When it is connected across a $20 \ V, 50 \ Hz$ $AC$ supply,it draws a current of $4 \ A$. The self-inductance of the coil is .............. $mH$. (Take $\pi=3$)
DifficultJEE MAIN 2024
View SolutionVedclass Products
For Students
Vedclass Test Series
Mock tests in real JEE/NEET style with performance analysis. 5-day free trial.
Start Free TrialFor Teachers
Exam Paper Generator
Generate Set A/B/C/D exam papers from 7.5L+ questions in 2 minutes. 3 chapters free.
Try FreeFor Institutes
Online Exam Module
Live online exams with unlimited students, 360° analytics & white-label branding.
See Demo