
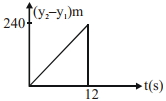
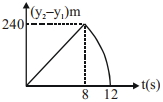
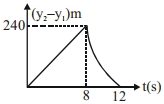
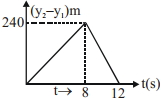
Two stones are thrown up simultaneously from the edge of a cliff $240 \ m$ high with initial speeds of $10 \ m/s$ and $40 \ m/s$ respectively. Which of the following graphs best represents the time variation of the relative position of the second stone with respect to the first? (Assume stones do not rebound after hitting the ground and neglect air resistance,take $g = 10 \ m/s^2$)
- A
- B
- C
- D
Explore More
Similar Questions
The figure shows the velocity $(v)$ of a particle plotted against time $(t)$.
Medium
View Solution$A$ particle of mass $m$ moves on the $x$-axis as follows: it starts from rest at $t = 0$ from the point $x = 0$ and comes to rest at $t = 1$ at the point $x = 1$. No other information is available about its motion at intermediate time $(0 < t < 1)$. If $\alpha$ denotes the instantaneous acceleration of the particle,then
DifficultIIT 1993
View SolutionThe relation between time $t$ and distance $x$ is $t = \alpha x^2 + \beta x$,where $\alpha$ and $\beta$ are constants. The relation between acceleration $a$ and velocity $v$ is:
DifficultJEE MAIN 2024
View SolutionWhat is reaction time? On what does the reaction time depend?
Medium
View Solution$A$ particle moves along the sides $AB, BC, CD$ of a square of side $25 \, m$ with a constant velocity of $15 \, m \, s^{-1}$. Its average velocity is ........ $m \, s^{-1}$.
Easy
View SolutionVedclass Products
For Students
Vedclass Test Series
Mock tests in real JEE/NEET style with performance analysis. 5-day free trial.
Start Free TrialFor Teachers
Exam Paper Generator
Generate Set A/B/C/D exam papers from 7.5L+ questions in 2 minutes. 3 chapters free.
Try FreeFor Institutes
Online Exam Module
Live online exams with unlimited students, 360° analytics & white-label branding.
See Demo