
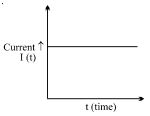
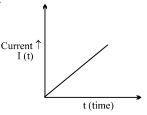
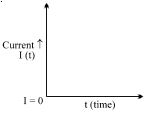
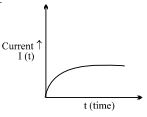
Two infinitely long conducting parallel rails are connected through a capacitor $C$ as shown in the figure. $A$ conductor of length $l$ is moved with constant speed $v_0$. Which of the following graphs truly depicts the variation of current through the conductor with time?
- A
- B
- C
- D
Explore More
Similar Questions
$A$ conducting wire $XY$ of mass $m$ and negligible resistance slides smoothly on two parallel conducting wires as shown in the figure. The closed circuit has a resistance $R$ due to $AC$. $AB$ and $CD$ are perfect conductors. There is a magnetic field $\vec{B} = B(t) \hat{k}$.
$(i)$ Write down the equation for the acceleration of the wire $XY$.
$(ii)$ If $\vec{B}$ is independent of time,obtain $v(t)$,assuming $v(0) = u_0$.
$(iii)$ For $(ii)$,show that the decrease in kinetic energy of $XY$ equals the heat lost in $R$.
$(i)$ Write down the equation for the acceleration of the wire $XY$.
$(ii)$ If $\vec{B}$ is independent of time,obtain $v(t)$,assuming $v(0) = u_0$.
$(iii)$ For $(ii)$,show that the decrease in kinetic energy of $XY$ equals the heat lost in $R$.
Difficult
View Solution$A$ metallic wire loop of side $l = 0.1 \text{ m}$ and resistance $1 \Omega$ is moved with a constant velocity in a uniform magnetic field of $2 \text{ Wb m}^{-2}$ as shown in the figure. The magnetic field is perpendicular to the plane of the loop. The loop is connected to a network of resistors. The velocity of the loop required to have a steady current of $1 \text{ mA}$ in the loop is: (in $\text{ cm s}^{-1}$)
$A$ conducting rod of length $L$ lies in the $XY$-plane and makes an angle $30^{\circ}$ with the $X$-axis. One end of the rod is initially at the origin. $A$ magnetic field exists in the region pointing along the positive $Z$-direction. The magnitude of the magnetic field varies with $y$ as $B = B_0 \left(\frac{y}{L}\right)^3$,where $B_0$ is a constant. At some instant,the rod starts moving with a velocity $v_0$ along the $X$-axis. The emf induced in the rod is
DifficultTS EAMCET 2018
View SolutionTo measure a magnetic field between the magnetic poles of a loudspeaker, a small coil having $30$ turns and $2.5 \, cm^2$ area is placed perpendicular to the field and removed immediately. If the total charge flown through the coil is $7.5 \times 10^{-3} \, C$ and the total resistance of the wire and galvanometer is $0.3 \, \Omega$, then the magnitude of the magnetic field is
DifficultAP EAMCET 2019
View Solution$A$ region in the form of an equilateral triangle (in $x-y$ plane) of height $L$ has a uniform magnetic field $\vec{B}$ pointing in the $+z$-direction. $A$ conducting loop $PQR$,in the form of an equilateral triangle of the same height $L$,is placed in the $x-y$ plane with its vertex $P$ at $x=0$ in the orientation shown in the figure. At $t=0$,the loop starts entering the region of the magnetic field with a uniform velocity $\vec{v}$ along the $+x$-direction. The plane of the loop and its orientation remain unchanged throughout its motion.
Which of the following graphs best depicts the variation of the induced emf $(E)$ in the loop as a function of the distance $(x)$ starting from $x=0$?
Which of the following graphs best depicts the variation of the induced emf $(E)$ in the loop as a function of the distance $(x)$ starting from $x=0$?
Vedclass Products
For Students
Vedclass Test Series
Mock tests in real JEE/NEET style with performance analysis. 5-day free trial.
Start Free TrialFor Teachers
Exam Paper Generator
Generate Set A/B/C/D exam papers from 7.5L+ questions in 2 minutes. 3 chapters free.
Try FreeFor Institutes
Online Exam Module
Live online exams with unlimited students, 360° analytics & white-label branding.
See Demo