
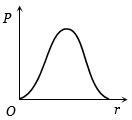
The charge density $P$ in a nucleus varies with distance $r$ from the centre of the nucleus according to the curve in the figure. Which of the following graphs correctly represents this variation?
- A
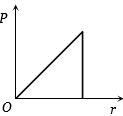
- B
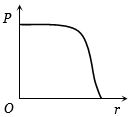
- C
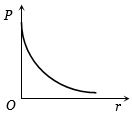
- D
Explore More
Similar Questions
The ratio of the density of oxygen nucleus $\left({ }_{8}^{16} O \right)$ and helium nucleus $\left({ }_{2}^{4} He \right)$ is (in $:1$)
How much was the radius of the nucleus estimated from the experiment of $\alpha -$ scattering?
Easy
View SolutionThe mass number of $He$ is $4$ and the mass number of $S$ is $32$. How many times is the radius of the $S$ nucleus compared to the radius of the $He$ nucleus?
Medium
View SolutionThe radius of the nucleus of an atom whose mass number is $125$ is:
The strongest force among the following forces in nature is
Vedclass Products
For Students
Vedclass Test Series
Mock tests in real JEE/NEET style with performance analysis. 5-day free trial.
Start Free TrialFor Teachers
Exam Paper Generator
Generate Set A/B/C/D exam papers from 7.5L+ questions in 2 minutes. 3 chapters free.
Try FreeFor Institutes
Online Exam Module
Live online exams with unlimited students, 360° analytics & white-label branding.
See Demo