
Class 11Physics10-1.Thermometry, Thermal Expansion and CalorimetryMix Examples-Thermometry, Thermal Expansion and Calorimetry
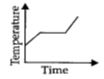
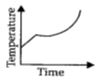
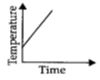
MediumLiquid oxygen at $50 \, K$ is heated to $300 \, K$ at a constant pressure of $1 \, atm$. If the rate of heating is constant,which of the following graphs represents the variation of temperature with time?
- A
- B
- C
- D

Explore More
Similar Questions
When water is heated from $0^{\circ}C$ to $4^{\circ}C$,which of the following relations holds true?
Medium
View Solution$A$ block of ice at $-12^{\circ} C$ is slowly heated and converted into steam at $100^{\circ} C$. Which of the following curves best represents the event?
Easy
View SolutionIf in the winter season the surface temperature of a lake is $1^{\circ} C$,the temperature at the bottom of the lake will be ............
Easy
View Solution$10\, g$ of a lead bullet travelling at $300\, m/s$ strikes against a block of wood and comes to rest. Assuming $50\%$ of the heat produced is absorbed by the bullet,the increase in its temperature is ........ $^\circ C$. (Specific heat of lead $= 150\, J/kg\cdot K$)
Medium
View Solution$A$ beaker of height $H$ is made up of a material whose coefficient of linear thermal expansion is $3\alpha$. It is filled up to the brim by a liquid whose coefficient of thermal expansion is $\alpha$. If now the beaker along with its contents is uniformly heated through a small temperature $T$,the level of liquid will reduce by (given $\alpha T << 1$):
Difficult
View SolutionVedclass Products
For Students
Vedclass Test Series
Mock tests in real JEE/NEET style with performance analysis. 5-day free trial.
Start Free TrialFor Teachers
Exam Paper Generator
Generate Set A/B/C/D exam papers from 7.5L+ questions in 2 minutes. 3 chapters free.
Try FreeFor Institutes
Online Exam Module
Live online exams with unlimited students, 360° analytics & white-label branding.
See Demo