
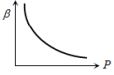
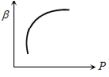
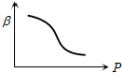
Which of the following graphs represents the variation of $\beta = -(dV/dP)$ with pressure $P$ for an ideal gas kept at a constant temperature?
- A
- B

- C
- D
Explore More
Similar Questions
Two gases of equal mass are in thermal equilibrium. If $P_a, P_b$ and $V_a, V_b$ are their respective pressures and volumes,then which relation is true?
Which one of the following schematic graphs best represents the variation of $p V$ (in Joules) versus $T$ (in Kelvin) of one mole of an ideal gas? (The dotted line represents $p V=T$)
$A$ vessel containing nitrogen gas is supplied a heat of $498 \,J$, so as to raise the temperature of the gas by $40^{\circ} C$ at constant pressure. The mass of nitrogen gas in the vessel is (Molecular mass of nitrogen $= 28 \,g/mol$; Universal gas constant $= 8.3 \,J \,mol^{-1} \,K^{-1}$) (in $\,g$)
From the following statements,concerning an ideal gas at any given temperature $T$,select the correct one$(s)$:
MediumIIT 1995
View SolutionAn insulated container containing a monoatomic gas of molar mass $M$ is moving with a velocity $V_{0}$. If the container is suddenly stopped,find the change in temperature.
Difficult
View SolutionVedclass Products
For Students
Vedclass Test Series
Mock tests in real JEE/NEET style with performance analysis. 5-day free trial.
Start Free TrialFor Teachers
Exam Paper Generator
Generate Set A/B/C/D exam papers from 7.5L+ questions in 2 minutes. 3 chapters free.
Try FreeFor Institutes
Online Exam Module
Live online exams with unlimited students, 360° analytics & white-label branding.
See Demo