
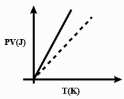
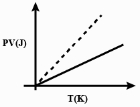
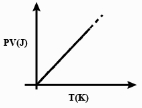
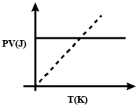
Which one of the following schematic graphs best represents the variation of $p V$ (in Joules) versus $T$ (in Kelvin) of one mole of an ideal gas? (The dotted line represents $p V=T$)
- A
- B
- C
- D
Explore More
Similar Questions
According to the kinetic theory of gases,which of the following statements is $WRONG$?
The plot that depicts the behavior of the mean free time $t$ (time between two successive collisions) for the molecules of an ideal gas,as a function of temperature $(T)$,qualitatively,is (Graphs are schematic and not drawn to scale)
From the following statements,concerning an ideal gas at any given temperature $T$,select the correct one$(s)$:
MediumIIT 1995
View SolutionThe adiabatic elasticity of hydrogen gas $(\gamma = 1.4)$ at $NTP$ is
Medium
View Solution$A$ fixed mass of gas at constant pressure occupies a volume $V$. The gas undergoes a rise in temperature so that the r.m.s. velocity of the molecules is doubled. The new volume will be
Vedclass Products
For Students
Vedclass Test Series
Mock tests in real JEE/NEET style with performance analysis. 5-day free trial.
Start Free TrialFor Teachers
Exam Paper Generator
Generate Set A/B/C/D exam papers from 7.5L+ questions in 2 minutes. 3 chapters free.
Try FreeFor Institutes
Online Exam Module
Live online exams with unlimited students, 360° analytics & white-label branding.
See Demo