
Class 11PhysicsKinetic Theory of GasesGas Laws (Charles, Boyle's, Avagadro's, Gay Lussacs and Dalton's law) and Ideal gas Equation
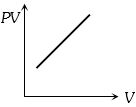
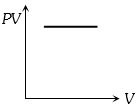
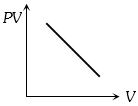
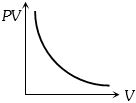
MediumWhich one of the following graphs represents the behavior of an ideal gas at a constant temperature?
- A
- B
- C
- D
Explore More
Similar Questions
$A$ gas has a volume of $251 \,cm^3$ at $20^{\circ} C$ and a pressure of $78 \,cm$ of $Hg$. Find its volume at $NTP$. (in $\,cm^3$)
An ideal gas is initially at temperature $T$ and volume $V.$ Its volume is increased by $\Delta V$ due to an increase in temperature $\Delta T,$ pressure remaining constant. The quantity $\delta = \Delta V / (V \Delta T)$ varies with temperature as
DifficultIIT 2000
View Solution$A$ gas of certain mass filled in a closed cylinder at a pressure of $3.23 \ kPa$ has a temperature of $50^{\circ} C$. The gas is now heated until its absolute temperature is doubled. The modified pressure is . . . . . . $Pa$.
$A$ monoatomic ideal gas of two moles is taken through a cyclic process starting from $1$ as shown. Given $\frac{V_2}{V_1} = 2$ and $\frac{V_4}{V_1} = 4$. The temperature at state $1$ is $T_1 = 27\,^oC$. Find the temperature at state $2$,i.e.,$T_2$ in $K$.
Medium
View SolutionCalculate the volume of vapour of $1\,g$ of water at $1\,atm$ pressure.
Medium
View SolutionVedclass Products
For Students
Vedclass Test Series
Mock tests in real JEE/NEET style with performance analysis. 5-day free trial.
Start Free TrialFor Teachers
Exam Paper Generator
Generate Set A/B/C/D exam papers from 7.5L+ questions in 2 minutes. 3 chapters free.
Try FreeFor Institutes
Online Exam Module
Live online exams with unlimited students, 360° analytics & white-label branding.
See Demo