
Medium
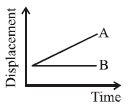
Which one of the following represents the displacement-time graph of two objects $A$ and $B$ moving with zero relative velocity?
- A
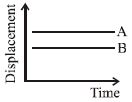
- B
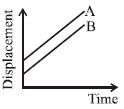
- C
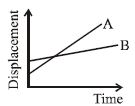
- D
Explore More
Similar Questions
$A$ particle of unit mass undergoes one-dimensional motion such that its velocity varies according to $v(x) = \beta x^{-2n}$,where $\beta$ and $n$ are constants and $x$ is the position of the particle. The acceleration of the particle as a function of $x$ is given by:
DifficultAIPMT 2015
View SolutionThe displacement-time graphs of two moving particles make angles of $30^{\circ}$ and $45^{\circ}$ with the time-axis as shown in the figure. The ratio of their respective velocities is:
MediumNEET 2022
View SolutionThe figure shows a velocity-time graph of a particle moving along a straight line. The particle comes to rest at $t = \dots \text{sec}$.
Easy
View SolutionThe figure shows the $x-t$ plot of a particle in one-dimensional motion. Three different equal intervals of time are shown. In which interval is the average speed greatest,and in which is it the least? Give the sign of average velocity for each interval.
Easy
View SolutionMatch Column-$I$ with Column-$II$ based on the distance-time $(d-t)$ graphs provided in the image.
$(1)$ Velocity decreases $(a)$ Linear graph (constant slope) $(2)$ Velocity increases $(b)$ Concave up graph (increasing slope) $(3)$ Velocity is constant $(c)$ Concave down graph (decreasing slope)
| $(1)$ Velocity decreases | $(a)$ Linear graph (constant slope) |
| $(2)$ Velocity increases | $(b)$ Concave up graph (increasing slope) |
| $(3)$ Velocity is constant | $(c)$ Concave down graph (decreasing slope) |
Easy
View SolutionVedclass Products
For Students
Vedclass Test Series
Mock tests in real JEE/NEET style with performance analysis. 5-day free trial.
Start Free TrialFor Teachers
Exam Paper Generator
Generate Set A/B/C/D exam papers from 7.5L+ questions in 2 minutes. 3 chapters free.
Try FreeFor Institutes
Online Exam Module
Live online exams with unlimited students, 360° analytics & white-label branding.
See Demo