
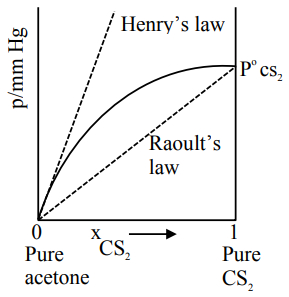
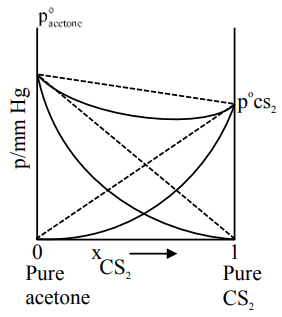
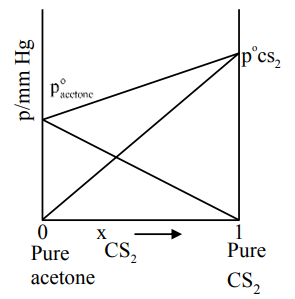
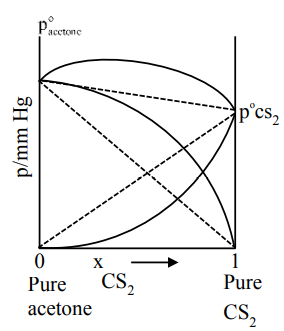
Which one of the following graphs accurately represents the plot of partial pressure of $CS_{2}$ vs its mole fraction in a mixture of acetone and $CS_{2}$ at constant temperature?
- A
- B
- C
- D
Explore More
Similar Questions
$A$ liquid mixture is an ideal solution,if
$(I)$ It obeys ideal gas equation
$(II)$ It obeys Raoult's law at all concentrations
$(III)$ Solute - solute,solute - solvent and solvent - solvent interactions are similar
$(I)$ It obeys ideal gas equation
$(II)$ It obeys Raoult's law at all concentrations
$(III)$ Solute - solute,solute - solvent and solvent - solvent interactions are similar
If liquids $A$ and $B$ form an ideal solution,then which of the following is true?
Easy
View SolutionBenzene and toluene form an ideal solution. If the partial vapor pressures of benzene and toluene are $1.55 \ kPa$ and $1.85 \ kPa$ respectively,what is the mole ratio of benzene to toluene in the solution?
Medium
View SolutionTwo liquids $A$ and $B$ form an ideal solution. When they are mixed in a molar ratio of $1:1$,the vapor pressure of the solution at $300 \ K$ is $400 \ mm \ Hg$. When they are mixed in a molar ratio of $1:2$,the vapor pressure of the solution at the same temperature is $350 \ mm \ Hg$. The vapor pressures of pure liquids $A$ and $B$ are respectively:
Which of the following statements is correct regarding a solution of two compounds $A$ and $B$ exhibiting positive deviation from ideal behaviour?
MediumNEET 2019
View SolutionVedclass Products
For Students
Vedclass Test Series
Mock tests in real JEE/NEET style with performance analysis. 5-day free trial.
Start Free TrialFor Teachers
Exam Paper Generator
Generate Set A/B/C/D exam papers from 7.5L+ questions in 2 minutes. 3 chapters free.
Try FreeFor Institutes
Online Exam Module
Live online exams with unlimited students, 360° analytics & white-label branding.
See Demo