
Medium
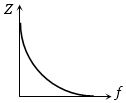
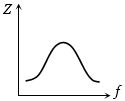
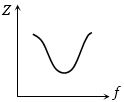
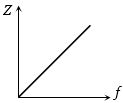
Which one of the following curves represents the variation of impedance $(Z)$ with frequency $(f)$ in a series $LCR$ circuit?
- A
- B
- C
- D
Explore More
Similar Questions
Draw phasor diagrams for $X_C > X_L$ and $X_C < X_L$,and state the disadvantages of the phasor method.
Medium
View SolutionWhich one of the following graphs correctly represents the variation of impedance $(Z)$ of a series $LCR$ circuit with the frequency $(v)$ of the applied $a.c.$?
As given in the figure,a series circuit connected across a $200\, V$,$60\, Hz$ line consists of a capacitor of capacitive reactance $30\,\Omega$,a non-inductive resistor of $44\,\Omega$,and a coil of inductive reactance $90\,\Omega$ and resistance $36\,\Omega$. The power dissipated in the coil is......$W$
Medium
View SolutionThe impedance of the given circuit is......$\Omega $
Easy
View SolutionIn an a.c. circuit containing $L, C$ and $R$ in series,the ratio of apparent power to the true power is ($Z$ and $R$ are the impedance and resistance respectively,$\phi$ = phase angle).
Vedclass Products
For Students
Vedclass Test Series
Mock tests in real JEE/NEET style with performance analysis. 5-day free trial.
Start Free TrialFor Teachers
Exam Paper Generator
Generate Set A/B/C/D exam papers from 7.5L+ questions in 2 minutes. 3 chapters free.
Try FreeFor Institutes
Online Exam Module
Live online exams with unlimited students, 360° analytics & white-label branding.
See Demo