
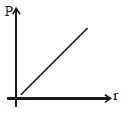
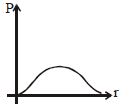
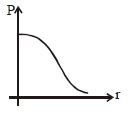
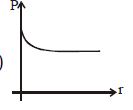
Which of the following graphs represents the variation of power loss in the external load with external resistance $R$?
- A
- B
- C
- D
Explore More
Similar Questions
The Thomson coefficient of a conductor is $10 \mu V/K$. The two ends of the conductor are kept at $50^{\circ} C$ and $60^{\circ} C$,respectively. The amount of heat absorbed by the conductor when a charge of $10 C$ flows through it is:
DifficultTS EAMCET 2001
View Solution$A$ power of $100 \ W$ is used at $125 \ V$ to produce chlorine by electrolysis. How many $mg$ of chlorine are produced per minute? (The electrochemical equivalent of chlorine is $0.367 \times 10^{-6} \ kg/C$)
Difficult
View Solution$A$ thermocouple develops $200\,\mu V$ between $0\,^{\circ}C$ and $100\,^{\circ}C$. If it develops $64\,\mu V$ and $76\,\mu V$ respectively between $(0\,^{\circ}C - 32\,^{\circ}C)$ and $(32\,^{\circ}C - 70\,^{\circ}C)$,then what will be the thermo-emf it develops between $70\,^{\circ}C$ and $100\,^{\circ}C$ in $\mu V$?
Medium
View SolutionIn the following circuit,a bulb is rated as $1.5\, V$,$0.45\, W$. If the bulb glows with full intensity,then what will be the equivalent resistance between $X$ and $Y$? ............. $\Omega$
Medium
View SolutionAssertion : An electric bulb becomes dim,when the electric heater in parallel circuit is switched on.
Reason : Dimness decreases after sometime.
Reason : Dimness decreases after sometime.
Vedclass Products
For Students
Vedclass Test Series
Mock tests in real JEE/NEET style with performance analysis. 5-day free trial.
Start Free TrialFor Teachers
Exam Paper Generator
Generate Set A/B/C/D exam papers from 7.5L+ questions in 2 minutes. 3 chapters free.
Try FreeFor Institutes
Online Exam Module
Live online exams with unlimited students, 360° analytics & white-label branding.
See Demo