
Class 11PhysicsKinetic Theory of GasesGas Laws (Charles, Boyle's, Avagadro's, Gay Lussacs and Dalton's law) and Ideal gas Equation
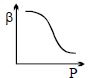
DifficultWhich of the following graphs correctly represents the variation of $\beta = - \left( \frac{dV}{dP} \right)/V$ with $P$ for an ideal gas at constant temperature?
- A

- B
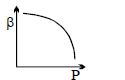
- C

- D
Explore More
Similar Questions
The graph of four gases with the same number of moles is given. Then:
Difficult
View SolutionWhich relation is correct for the given $P-V$ diagram?
Easy
View SolutionThe tyre of a motor car contains air at $15^{\circ} C$. If the temperature increases to $35^{\circ} C$,the approximate percentage increase in pressure is (ignore the expansion of the tyre).
DifficultAP EAMCET 2005
View SolutionThe temperature of an open room of volume $30\ m^3$ increases from $17^\circ C$ to $27^\circ C$ due to sunshine. The atmospheric pressure in the room remains $1 \times 10^5\ Pa$. If $n_i$ and $n_f$ are the number of molecules in the room before and after heating,then $n_f - n_i$ will be:
What is molar volume? Write its $SI$ unit.
Medium
View SolutionVedclass Products
For Students
Vedclass Test Series
Mock tests in real JEE/NEET style with performance analysis. 5-day free trial.
Start Free TrialFor Teachers
Exam Paper Generator
Generate Set A/B/C/D exam papers from 7.5L+ questions in 2 minutes. 3 chapters free.
Try FreeFor Institutes
Online Exam Module
Live online exams with unlimited students, 360° analytics & white-label branding.
See Demo