
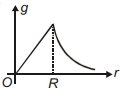
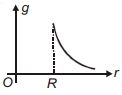
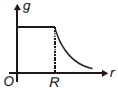
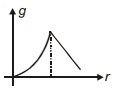
Which of the following graphs represents the variation of acceleration due to gravity $(g)$ with distance $r$ from the centre of the Earth?
- A
- B
- C
- D
Explore More
Similar Questions
$A$ tunnel is dug along a diameter of the Earth. If $M_e$ and $R_e$ are the mass and radius of the Earth respectively,then the force on a particle of mass $m$ placed in the tunnel at a distance $r$ from the center is:
Difficult
View SolutionThe angular velocity of the Earth at present is $\omega$. With what angular velocity should it rotate so that the weight of a body at the equator appears to be zero (in $\omega$)? (Express the answer as a multiple of $\omega$)
Medium
View SolutionThe radius of the Earth is $6400 \,km$ and the acceleration due to gravity is $g=10 \,ms^{-2}$. For the weight of a body of mass $5 \,kg$ to be zero at the equator,the rotational angular velocity of the Earth must be (in $rad/s$):
Calculate the difference in the value of $g$ at the equator and at the poles due to the rotation of the Earth.
Medium
View Solution$A$ hole is drilled through the Earth along a diameter and a stone is dropped into it. When the stone reaches the center of the Earth,which of the following quantities remains constant?
Easy
View SolutionVedclass Products
For Students
Vedclass Test Series
Mock tests in real JEE/NEET style with performance analysis. 5-day free trial.
Start Free TrialFor Teachers
Exam Paper Generator
Generate Set A/B/C/D exam papers from 7.5L+ questions in 2 minutes. 3 chapters free.
Try FreeFor Institutes
Online Exam Module
Live online exams with unlimited students, 360° analytics & white-label branding.
See Demo