
Which graph represents a zero order reaction $[A_{(g)} \to B_{(g)}]$?
- A
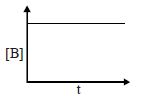
- B
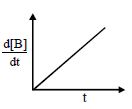
- C
- D
Explore More
Similar Questions
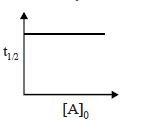
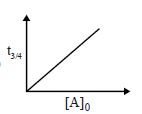
Which of the following plots is correct for a zero-order reaction?
Consider the data given below for the hypothetical reaction $A \to X$:
$Time \ (s)$ $Rate \ (mol \ L^{-1} s^{-1})$ $0$ $1.60 \times 10^{-2}$ $10$ $1.60 \times 10^{-2}$ $20$ $1.60 \times 10^{-2}$ $30$ $1.60 \times 10^{-2}$
From the above data,the order of the reaction is:
| $Time \ (s)$ | $Rate \ (mol \ L^{-1} s^{-1})$ |
|---|---|
| $0$ | $1.60 \times 10^{-2}$ |
| $10$ | $1.60 \times 10^{-2}$ |
| $20$ | $1.60 \times 10^{-2}$ |
| $30$ | $1.60 \times 10^{-2}$ |
From the above data,the order of the reaction is:
Medium
View SolutionThe reaction $A \to \text{Products}$ is a zero-order reaction. If the initial concentration of $A$ is $2 \ M$,then at time $t = 1/K$ (where $K$ is the rate constant),the concentration of $A$ will be ......... $M$.
Easy
View SolutionMention True $(T)$ and False $(F)$ statements for the following regarding a zero-order reaction $R \rightarrow P$:
$1. \ t_{1/2} \propto [R]_0$
$2. \ t_{1/2} \propto k$
$1. \ t_{1/2} \propto [R]_0$
$2. \ t_{1/2} \propto k$
Easy
View SolutionIf the rate of the reaction is equal to the rate constant,the order of the reaction is
Vedclass Products
For Students
Vedclass Test Series
Mock tests in real JEE/NEET style with performance analysis. 5-day free trial.
Start Free TrialFor Teachers
Exam Paper Generator
Generate Set A/B/C/D exam papers from 7.5L+ questions in 2 minutes. 3 chapters free.
Try FreeFor Institutes
Online Exam Module
Live online exams with unlimited students, 360° analytics & white-label branding.
See Demo