
Class 11Physics10-1.Thermometry, Thermal Expansion and CalorimetryMix Examples-Thermometry, Thermal Expansion and Calorimetry
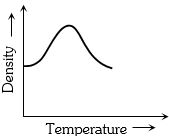
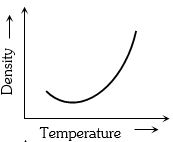
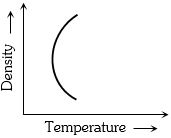
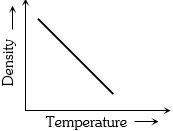
EasyThe variation of density of water with temperature is represented by the
- A
- B
- C
- D
Explore More
Similar Questions
The ratio of the coefficient of volume expansion of a glass container to that of a viscous liquid kept inside the container is $1 : 4$. What fraction of the inner volume of the container should the liquid occupy so that the volume of the remaining vacant space will be same at all temperatures?
Statement $(I)$: $A$ device in which heat measurement can be made is called a calorimeter.
Statement $(II)$: Skating is possible on snow due to the formation of water below the skates. Water is formed due to the increase of temperature and ice melts.
Statement $(III)$: Two bodies at different temperatures are mixed in a calorimeter. The total internal energy of the two bodies remains conserved.
Which of the following is correct?
DifficultTS EAMCET 2022
View SolutionThermal expansion due to an increase in temperature...
Medium
View SolutionHow much thermal energy is required to change a $40 \ g$ ice cube from solid at $-10^{\circ} C$ to steam at $110^{\circ} C$ (in $kcal$)?
[Assume,latent heat of fusion for water $= 80 \ kcal/kg$,specific heat of water $= 1 \ kcal/kg^{\circ} C$,specific heat of ice $= 0.5 \ kcal/kg^{\circ} C$,specific heat of steam $= 0.48 \ kcal/kg^{\circ} C$,latent heat of vaporisation of water $= 540 \ kcal/kg$]
[Assume,latent heat of fusion for water $= 80 \ kcal/kg$,specific heat of water $= 1 \ kcal/kg^{\circ} C$,specific heat of ice $= 0.5 \ kcal/kg^{\circ} C$,specific heat of steam $= 0.48 \ kcal/kg^{\circ} C$,latent heat of vaporisation of water $= 540 \ kcal/kg$]
$A$ hailstone of mass $42 \,g$ falls from a height of $1.8 \,km$. If its entire potential energy is converted into latent heat, what is the mass of the hailstone remaining when it reaches the ground (in $\,g$)? $\left(g=10 \,ms^{-2}, L_{\text{ice}}=3.36 \times 10^5 \,J \,kg^{-1}\right)$
Vedclass Products
For Students
Vedclass Test Series
Mock tests in real JEE/NEET style with performance analysis. 5-day free trial.
Start Free TrialFor Teachers
Exam Paper Generator
Generate Set A/B/C/D exam papers from 7.5L+ questions in 2 minutes. 3 chapters free.
Try FreeFor Institutes
Online Exam Module
Live online exams with unlimited students, 360° analytics & white-label branding.
See Demo