
Class 11Physics10-1.Thermometry, Thermal Expansion and CalorimetryHeat Capacity, Specific Heat and Molar Specific Heat
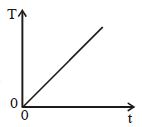
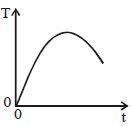
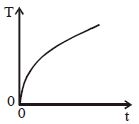
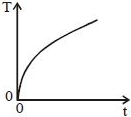
DifficultAt temperatures close to $0\ K$, the heat capacity $C$ of a certain solid is related to its temperature $T$ by the equation $C = aT^3$, where $a$ is a constant characteristic of the solid. Heat is supplied to the solid at a steady rate. Which graph best represents the variation of its temperature $T$ with time $t$?
- A
- B
- C
- D
Explore More
Similar Questions
The factor not needed to calculate heat lost or gained when there is no change of state is
Easy
View SolutionThe specific heat capacity of a copper block of mass $M$ is $s$. If the mass of the copper block is doubled,the specific heat capacity will be
Write the value of the specific heat capacity of water with its unit.
Medium
View SolutionThe temperature of $5$ moles of a gas at constant volume is changed from $100^{\circ} C$ to $120^{\circ} C$. The change in internal energy is $80 \,J$. The total heat capacity of the gas at constant volume in $J/K$ is:
The specific heat capacity of a substance is temperature dependent and is given by the formula $C = kT$,where $k$ is a constant of suitable dimensions in $SI$ units,and $T$ is the absolute temperature. If the heat required to raise the temperature of $1 \ kg$ of the substance from $-73^{\circ} C$ to $27^{\circ} C$ is $nk$,the value of $n$ is. . . . . . [Given: $0 \ K = -273^{\circ} C$.]
MediumIIT 2024
View SolutionVedclass Products
For Students
Vedclass Test Series
Mock tests in real JEE/NEET style with performance analysis. 5-day free trial.
Start Free TrialFor Teachers
Exam Paper Generator
Generate Set A/B/C/D exam papers from 7.5L+ questions in 2 minutes. 3 chapters free.
Try FreeFor Institutes
Online Exam Module
Live online exams with unlimited students, 360° analytics & white-label branding.
See Demo