
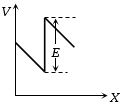
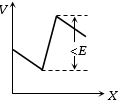
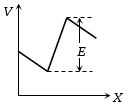
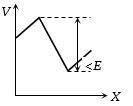
The two ends of a uniform conductor are joined to a cell of $e.m.f.$ $E$ and some internal resistance. Starting from the midpoint $P$ of the conductor,we move in the direction of current and return to $P$. The potential $V$ at every point on the path is plotted against the distance covered $(x)$. Which of the following graphs best represents the resulting curve?
- A
- B
- C
- D
Explore More
Similar Questions
Antimony and bismuth are usually used in a thermocouple,because
Medium
View SolutionWhen a current $I$ is passed through a wire of constant resistance,it produces a potential difference $V$ across its ends. The graph drawn between $\log I$ and $\log V$ will be:
Easy
View SolutionTwo electric bulbs marked $40\,W, 220\,V$ and $60\,W, 220\,V$ are connected in series across a $220\,V$ supply,resulting in an effective power $P_1$. When they are connected in parallel across the same $220\,V$ supply,the effective power is $P_2$. The ratio $\frac{P_1}{P_2}$ is:
Medium
View SolutionSuppose switches $S_1, S_2$ and so on up to $S_6$ are closed one after another in order (first $S_1$,then $S_2$,etc.) at regular intervals of $1 \text{ minute}$ starting from $t = 0$. The graph of current versus time is best represented as:
Two different metals are joined end to end. One end is kept at a constant temperature and the other end is heated to a very high temperature. The graph depicting the thermo $e.m.f.$ $(E)$ versus temperature $(t)$ is:
Medium
View SolutionVedclass Products
For Students
Vedclass Test Series
Mock tests in real JEE/NEET style with performance analysis. 5-day free trial.
Start Free TrialFor Teachers
Exam Paper Generator
Generate Set A/B/C/D exam papers from 7.5L+ questions in 2 minutes. 3 chapters free.
Try FreeFor Institutes
Online Exam Module
Live online exams with unlimited students, 360° analytics & white-label branding.
See Demo