
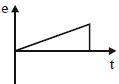
The figure shown has two coils of wires placed in close proximity. The current in primary coil $P$ is made to vary with time as shown in the graph. Which of the following graphs best represents the variation of the emf induced in the secondary coil $S$?
- A
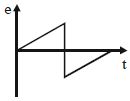
- B
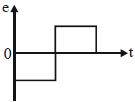
- C
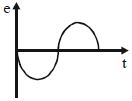
- D
Explore More
Similar Questions
Two metallic rings $A$ and $B$,identical in shape and size but having different resistivities $\rho_A$ and $\rho_B$,are kept on top of two identical solenoids as shown in the figure. When current $I$ is switched on in both the solenoids in an identical manner,the rings $A$ and $B$ jump to heights $h_A$ and $h_B$,respectively,with $h_A > h_B$. The possible relation$(s)$ between their resistivities and their masses $m_A$ and $m_B$ is(are):
$(A)$ $\rho_A > \rho_B$ and $m_A = m_B$
$(B)$ $\rho_A < \rho_B$ and $m_A = m_B$
$(C)$ $\rho_A > \rho_B$ and $m_A > m_B$
$(D)$ $\rho_A < \rho_B$ and $m_A < m_B$
$(A)$ $\rho_A > \rho_B$ and $m_A = m_B$
$(B)$ $\rho_A < \rho_B$ and $m_A = m_B$
$(C)$ $\rho_A > \rho_B$ and $m_A > m_B$
$(D)$ $\rho_A < \rho_B$ and $m_A < m_B$
DifficultIIT 2009
View SolutionAn electron is moving in a circular orbit of radius $R$ with an angular acceleration $\alpha$. At the centre of the orbit is kept a conducting loop of radius $r$ $(r \ll R)$. The $e.m.f.$ induced in the smaller loop due to the motion of the electron is
The current through a coil varies according to the following graph. Plot the graph for induced $emf$ $(e)$ versus time $(t)$ for the coil.
Difficult
View Solution$A$ conducting square loop initially lies in the $XZ$ plane with its lower edge hinged along the $X$-axis. Only in the region $y \geq 0$,there is a time-dependent magnetic field pointing along the $Z$-direction,$\vec{B}(t) = B_0(\cos \omega t) \hat{k}$,where $B_0$ is a constant. The magnetic field is zero everywhere else. At time $t=0$,the loop starts rotating with constant angular speed $\omega$ about the $X$-axis in the clockwise direction as viewed from the $+X$ axis (as shown in the figure). Ignoring self-inductance of the loop and gravity,which of the following plots correctly represents the induced e.m.f. $(V)$ in the loop as a function of time?
$A$ rectangular loop is being pulled at a constant speed $v$,through a region of certain thickness $d$,in which a uniform magnetic field $B$ is set up. The graph between position $x$ of the right-hand edge of the loop and the induced emf $E$ will be
Medium
View SolutionVedclass Products
For Students
Vedclass Test Series
Mock tests in real JEE/NEET style with performance analysis. 5-day free trial.
Start Free TrialFor Teachers
Exam Paper Generator
Generate Set A/B/C/D exam papers from 7.5L+ questions in 2 minutes. 3 chapters free.
Try FreeFor Institutes
Online Exam Module
Live online exams with unlimited students, 360° analytics & white-label branding.
See Demo