
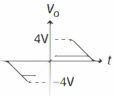
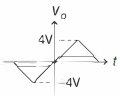
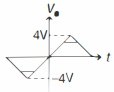
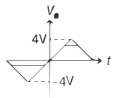
The figure below shows a circuit and its input voltage $V_i$ as a function of time $t$. Assuming the diodes to be ideal,which of the following graphs depicts the output voltage $V_o$ as a function of time $t$?
- A
- B
- C
- D
Explore More
Similar Questions
If a centre-tap transformer is used with two $p-n$ junction diodes for full-wave rectification,then the output voltage of the rectifier with respect to each diode is (secondary voltage of transformer $= V_s$)
What is rectification and rectifier? Why is a $p-n$ junction diode used as a rectifier?
Medium
View SolutionIn the block diagram of a simple rectifier circuit,from a variable $A.C.$ voltage,constant $D.C.$ voltage is obtained. The correct order of operation is
If in a $p-n$ junction circuit,a square input signal of $5\,V$ is applied as shown,then the output across $R_L$ will be:
Medium
View Solution$A$ $p-n$ junction diode $(D)$ shown in the figure can act as a rectifier. An alternating current source $(V)$ is connected in the circuit. The current $(I)$ in the resistor $(R)$ can be shown by:
MediumAIEEE 2009
View SolutionVedclass Products
For Students
Vedclass Test Series
Mock tests in real JEE/NEET style with performance analysis. 5-day free trial.
Start Free TrialFor Teachers
Exam Paper Generator
Generate Set A/B/C/D exam papers from 7.5L+ questions in 2 minutes. 3 chapters free.
Try FreeFor Institutes
Online Exam Module
Live online exams with unlimited students, 360° analytics & white-label branding.
See Demo