
Difficult
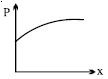
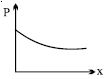
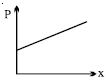
The cross-sectional area of a horizontal tube increases along its length linearly as we move in the direction of flow. The variation of pressure, as we move along its length in the direction of flow ($x$-direction), is best depicted by which of the following graphs?
- A
- B
- C
- D

Explore More
Similar Questions
Write two parts of fluid mechanics and what studies are made in them?
Easy
View SolutionThe heart of a man pumps $5 \, \text{litres}$ of blood through the arteries per minute at a pressure of $150 \, \text{mm}$ of mercury. If the density of mercury is $13.6 \times 10^3 \, \text{kg/m}^3$ and $g = 10 \, \text{m/s}^2$, then the power (in $\text{watt}$) is:
MediumAIPMT 2015
View Solution$A$ drop of liquid of density $\rho$ is floating half-immersed in a liquid of density $d$. If $T$ is the surface tension,then the diameter of the drop is:
DifficultMHT CET 2021
View Solution$A$ liquid kept in a cylindrical vessel is rotated about a vertical axis passing through the center of the circular base. The difference in the heights of the liquid at the center of the vessel and its edge is ($R=$ radius of vessel,$\omega=$ angular velocity of rotation,$g=$ acceleration due to gravity).
DifficultMHT CET 2020
View SolutionTwo identical cylindrical vessels with their bases at the same level, each contains a liquid of density $d$. The height of the liquid in one vessel is $h_1$ and that in the other vessel is $h_2$. The area of either base is $A$. The work done by gravity in equalizing the levels when the two vessels are connected is
Medium
View SolutionVedclass Products
For Students
Vedclass Test Series
Mock tests in real JEE/NEET style with performance analysis. 5-day free trial.
Start Free TrialFor Teachers
Exam Paper Generator
Generate Set A/B/C/D exam papers from 7.5L+ questions in 2 minutes. 3 chapters free.
Try FreeFor Institutes
Online Exam Module
Live online exams with unlimited students, 360° analytics & white-label branding.
See Demo