
The box in the circuit below has two inputs marked $V_{+}$ and $V_{-}$ and a single output marked $V_{o}$. The output obeys the following relation:
$V_{o} = \begin{cases} +10 \, V & \text{if } V_{+} > V_{-} \\ -10 \, V & \text{if } V_{+} < V_{-} \end{cases}$
Which of the following graphs represents the output $V_{o}$ as a function of time $t$?
$V_{o} = \begin{cases} +10 \, V & \text{if } V_{+} > V_{-} \\ -10 \, V & \text{if } V_{+} < V_{-} \end{cases}$
Which of the following graphs represents the output $V_{o}$ as a function of time $t$?
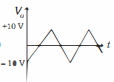
- A
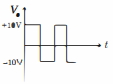
- B
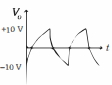
- C
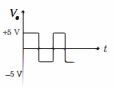
- D
Explore More
Similar Questions
An amplifier has a voltage gain $A_v = 1000$. The voltage gain in $dB$ is...........
Two amplifiers are connected one after the other in series (cascade). The first amplifier has a voltage gain of $10$ and the second has a voltage gain of $20$. If the input signal is $0.01\, V$,the output $ac$ signal will be........$V$.
Medium
View SolutionGiven below are two statements:
Statement $I$: Photovoltaic devices can convert optical radiation into electricity.
Statement $II$: Zener diode is designed to operate under reverse bias in the breakdown region.
In the light of the above statements,choose the most appropriate answer from the options given below:
Statement $I$: Photovoltaic devices can convert optical radiation into electricity.
Statement $II$: Zener diode is designed to operate under reverse bias in the breakdown region.
In the light of the above statements,choose the most appropriate answer from the options given below:
MediumNEET 2023
View SolutionFind the value of current $I$ in the following circuits.
Difficult
View SolutionIn the circuit given below, $V(t)$ is the sinusoidal voltage source. The voltage drop $V_{AB}(t)$ across the resistance $R$ is:
MediumIIT 1993
View SolutionVedclass Products
For Students
Vedclass Test Series
Mock tests in real JEE/NEET style with performance analysis. 5-day free trial.
Start Free TrialFor Teachers
Exam Paper Generator
Generate Set A/B/C/D exam papers from 7.5L+ questions in 2 minutes. 3 chapters free.
Try FreeFor Institutes
Online Exam Module
Live online exams with unlimited students, 360° analytics & white-label branding.
See Demo